OPEN-SOURCE SCRIPT
SCTR's
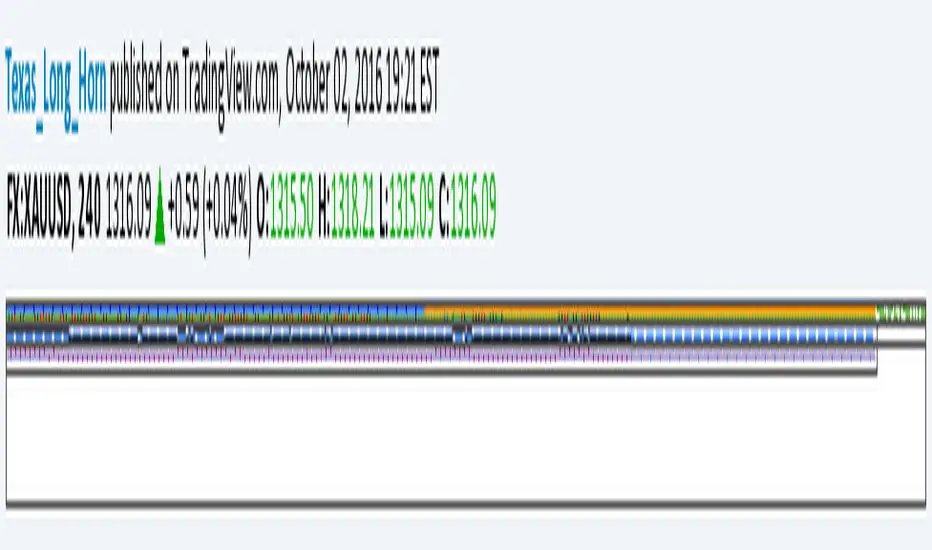
Inspired by John Murphy from Stock Charts, I build this indicator including the Long term, middle term and short term parameter. As John Murphy design, I kept the same proportion of the long, mid and short term as 60%, 30% and 10% but all could by modulated. This indicator is very simple and It range from 0.1 to 99.9, mean that full bullish is close of 99.9 and full bearish is close to 0.1. The 50's is the middle and mean there is no trend. As RSI, It could be interpreted as divergence or convergence pattern, and it's interesting to figure with RSI together to indentified the strongest of trend. You can learn more about SCTR's at stockcharts.com/school/doku.php?id=chart_school:technical_indicators:sctr
Enjoy this power full indicator
Enjoy this power full indicator
Open-source script
In true TradingView spirit, the creator of this script has made it open-source, so that traders can review and verify its functionality. Kudos to the author! While you can use it for free, remember that republishing the code is subject to our House Rules.
Disclaimer
The information and publications are not meant to be, and do not constitute, financial, investment, trading, or other types of advice or recommendations supplied or endorsed by TradingView. Read more in the Terms of Use.