OPEN-SOURCE SCRIPT
Volume Chart
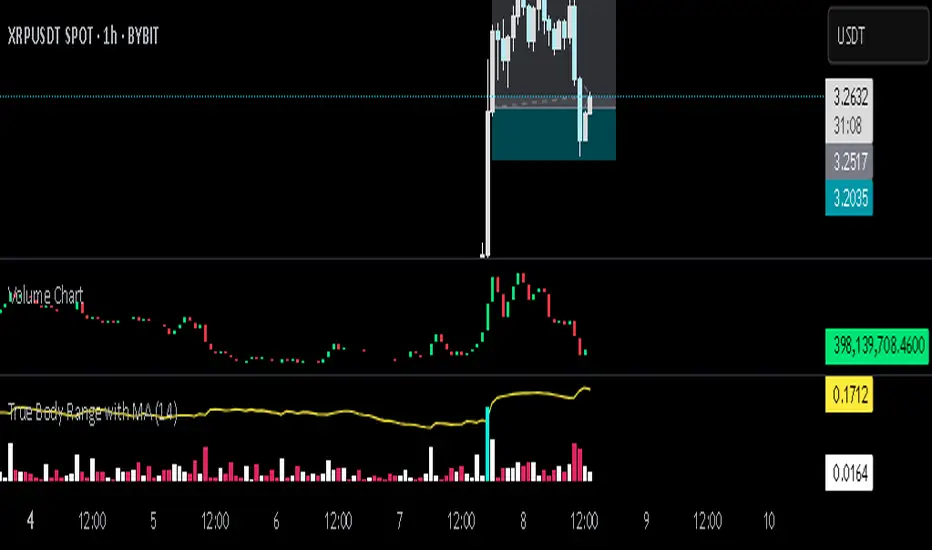
This Pine Script indicator, written in TradingView’s version 6, visualizes trading volume as a custom candlestick chart instead of a standard histogram. Rather than plotting volume bars, it constructs synthetic candles where each candle’s "open" is set to the previous candle’s "close" (stored in prevClose). The "close" of the synthetic candle moves upward by the volume value if the actual price candle was bullish (close > open) and downward by the volume value if it was bearish, with the "high" and "low" both fixed to the open to create a flat candle body line. This transforms volume into a price-like cumulative visual flow, color-coded green for bullish and red for bearish periods, allowing traders to intuitively track whether volume pressure is accumulating upward or downward over time, as though volume itself were moving like a market price series.
Open-source script
In true TradingView spirit, the creator of this script has made it open-source, so that traders can review and verify its functionality. Kudos to the author! While you can use it for free, remember that republishing the code is subject to our House Rules.
Disclaimer
The information and publications are not meant to be, and do not constitute, financial, investment, trading, or other types of advice or recommendations supplied or endorsed by TradingView. Read more in the Terms of Use.