OPEN-SOURCE SCRIPT
Updated Support & Resistance Parser
I've created a user-friendly trading indicator that interprets and visually presents support and resistance levels, transforming raw data into actionable insights.
Here's a glimpse of what you might encounter:
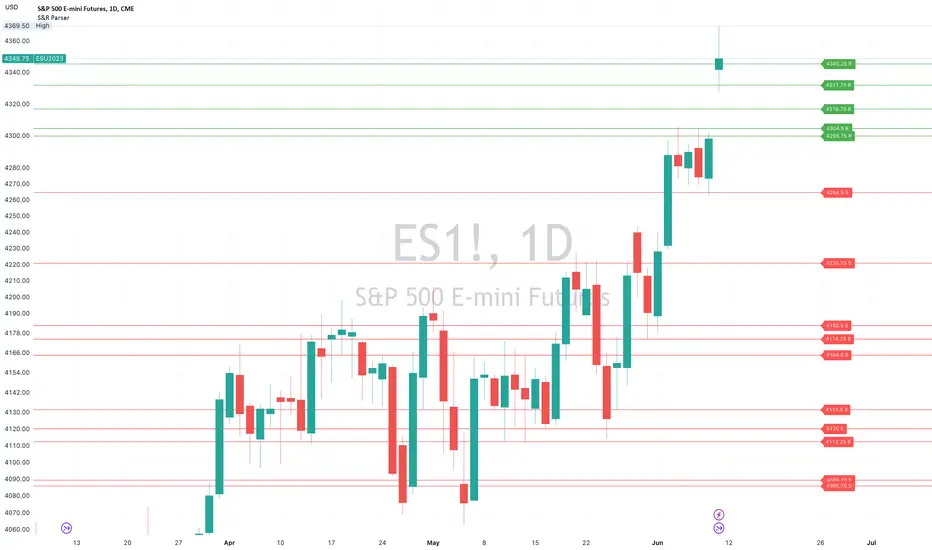
Today's trigger points (ES)
Support: 4264.5,4220.75,4131.5,4164.5,3980.75,4182.5,4174.25,4120,4112.25,4089.25,4085.75
Resistance: 4299.75,4304.5,4316.75,4345.25,4331.75
This is how it works:
1. Copy the series of support and resistance figures, ie just the comma separated numbers
2. Paste each series into their respective setting in the indicator.
3. The indicator parses the data, understanding the sequence and importance of each figure.
4. It then draws the corresponding support and resistance lines on your trading chart.
Chart would appear similar to the following:

This tool distinguishes itself with its user-friendly features. Each line comes with adjustable labels, enabling users to personalize their visualization. This makes the data more intuitive and easier to comprehend, enhancing decision-making during trades.
Note: The indicator includes limited error handling capabilities.
Make the most out of your trading journey with this intuitive and customizable tool, specifically designed to turn raw data into valuable trading insights.
Here's a glimpse of what you might encounter:
Today's trigger points (ES)
Support: 4264.5,4220.75,4131.5,4164.5,3980.75,4182.5,4174.25,4120,4112.25,4089.25,4085.75
Resistance: 4299.75,4304.5,4316.75,4345.25,4331.75
This is how it works:
1. Copy the series of support and resistance figures, ie just the comma separated numbers
2. Paste each series into their respective setting in the indicator.
3. The indicator parses the data, understanding the sequence and importance of each figure.
4. It then draws the corresponding support and resistance lines on your trading chart.
Chart would appear similar to the following:
This tool distinguishes itself with its user-friendly features. Each line comes with adjustable labels, enabling users to personalize their visualization. This makes the data more intuitive and easier to comprehend, enhancing decision-making during trades.
Note: The indicator includes limited error handling capabilities.
Make the most out of your trading journey with this intuitive and customizable tool, specifically designed to turn raw data into valuable trading insights.
Release Notes
Updating ChartOpen-source script
In true TradingView spirit, the creator of this script has made it open-source, so that traders can review and verify its functionality. Kudos to the author! While you can use it for free, remember that republishing the code is subject to our House Rules.
Disclaimer
The information and publications are not meant to be, and do not constitute, financial, investment, trading, or other types of advice or recommendations supplied or endorsed by TradingView. Read more in the Terms of Use.
Open-source script
In true TradingView spirit, the creator of this script has made it open-source, so that traders can review and verify its functionality. Kudos to the author! While you can use it for free, remember that republishing the code is subject to our House Rules.
Disclaimer
The information and publications are not meant to be, and do not constitute, financial, investment, trading, or other types of advice or recommendations supplied or endorsed by TradingView. Read more in the Terms of Use.