PROTECTED SOURCE SCRIPT
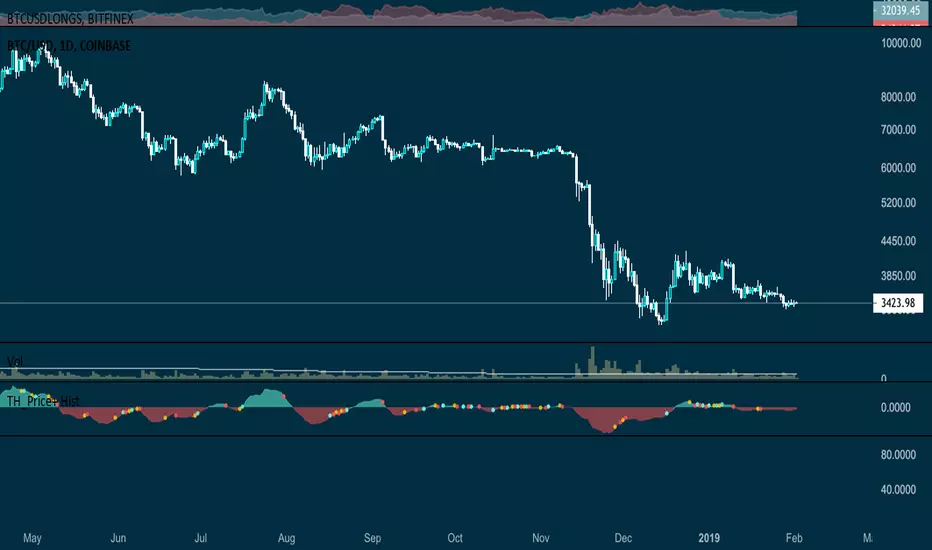
TH_Price+ Histogram

Price plotted into centralized oscillator normalized via 7/14 moving averages. The Histogram reveal longer trends while flags warn for early entry/exits. This script has been backtested with astonishing results particularly on 4H and Daily timeframes.
You can use this in combination with Hull+ or Delta Map (Premium), RSI+ or RSI Delta (Premium) and also OBV+ Histogram for stronger confirmations.
You can use this in combination with Hull+ or Delta Map (Premium), RSI+ or RSI Delta (Premium) and also OBV+ Histogram for stronger confirmations.
Protected script
This script is published as closed-source. However, you can use it freely and without any limitations – learn more here.
D7R
Disclaimer
The information and publications are not meant to be, and do not constitute, financial, investment, trading, or other types of advice or recommendations supplied or endorsed by TradingView. Read more in the Terms of Use.