Dilip Money Flow
This indicator is a superb upgrade to my original Money flow indicators.
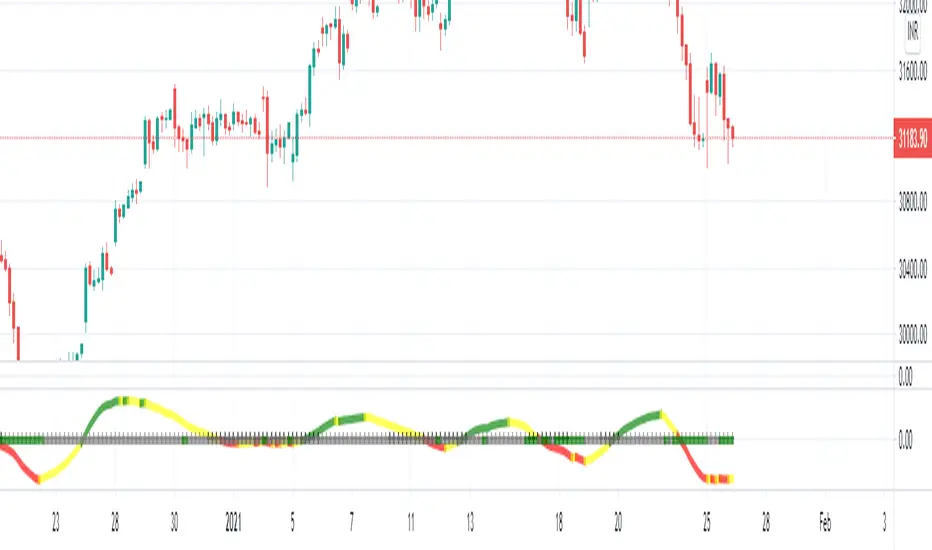
You now how the option to adjust the displayed volume timeframe, which in turn adjusts the Money Flow Moving Averages, along with the new Breakout Candle feature.
Additionally, the background colors represent the volume flow crossovers on the primary time-frame, along with three addition time-frames that are user adjustable.
The primary volume flow crossover is shown on the top of the grid, followed by the First Additional Time Frame and then so on down to the bottom.
I generally have this set with the lowest timeframe value at the top, followed by the next one in line.
Note: Since volume amounts vary across the board. The background height is set to readjust based on the highest bars. This lookback amount is adjustable by the user and it does not affect calculations what so ever.
I find, with the standard settings, it works best on the 1 hour timeframe as shown, but again, can be used on any time frame.
For access, send me a DM on TradingView
Invite-only script
Only users approved by the author can access this script. You'll need to request and get permission to use it. This is typically granted after payment. For more details, follow the author's instructions below or contact dilipchowdarythamma directly.
TradingView does NOT recommend paying for or using a script unless you fully trust its author and understand how it works. You may also find free, open-source alternatives in our community scripts.
Author's instructions
Disclaimer
Invite-only script
Only users approved by the author can access this script. You'll need to request and get permission to use it. This is typically granted after payment. For more details, follow the author's instructions below or contact dilipchowdarythamma directly.
TradingView does NOT recommend paying for or using a script unless you fully trust its author and understand how it works. You may also find free, open-source alternatives in our community scripts.