OPEN-SOURCE SCRIPT
D-LEVELS **FUTURECODE**
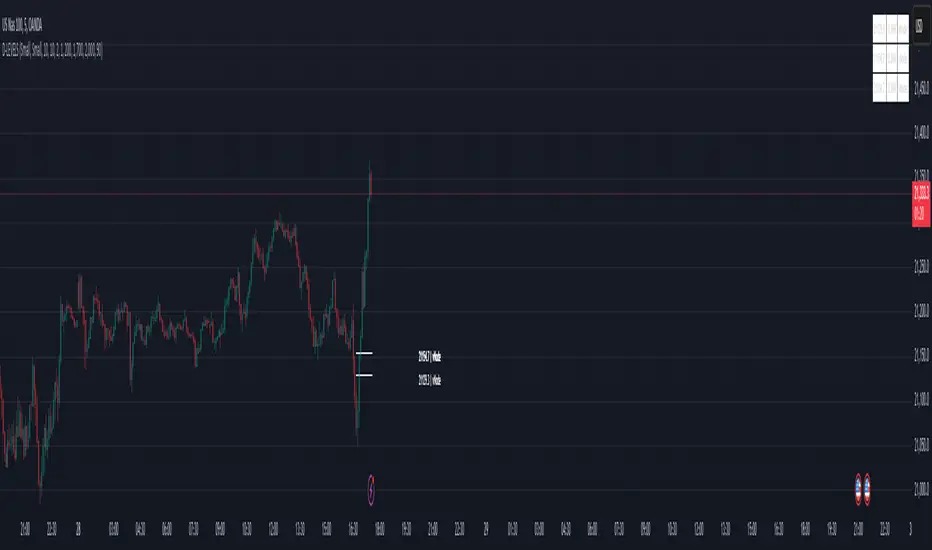
The D-LEVELS indicator helps traders identify key price levels based on high-volume nodes and their relative positions to the current price. It visually displays these dynamic levels on the chart, offering insights into potential support, resistance, or zones of interest for trading decisions.
Key Features for Traders:
Dynamic Volume Nodes: Highlights high-volume price levels across different lookback periods, which can act as support or resistance.
Custom Alerts: Warns traders when price is within a specified percentage range of these levels.
Visual Cues: Uses labels and lines with customizable colors and widths for better chart clarity.
Table Display: Summarizes volume node price levels and their relative percentages for quick reference.
Customization: Flexible input options for text size, colors, and display settings to adapt to individual trading styles.
Use Case:
Traders can incorporate this indicator into their strategy to identify high-probability zones for entries, exits, or trade management by observing the interaction of price with these volume-based levels.
Open-source script
In true TradingView spirit, the creator of this script has made it open-source, so that traders can review and verify its functionality. Kudos to the author! While you can use it for free, remember that republishing the code is subject to our House Rules.
Disclaimer
The information and publications are not meant to be, and do not constitute, financial, investment, trading, or other types of advice or recommendations supplied or endorsed by TradingView. Read more in the Terms of Use.