OPEN-SOURCE SCRIPT
Updated Inside Candle Viewer
Inside Candle Viewer
What it’s meant for:
- This indicator is used to identify inside candles that might generate an upcoming trading range
- Works best on large timeframe (Suggested from 2 days up to 1 week) and crypto asset (Index don't show much because of daily gaps)
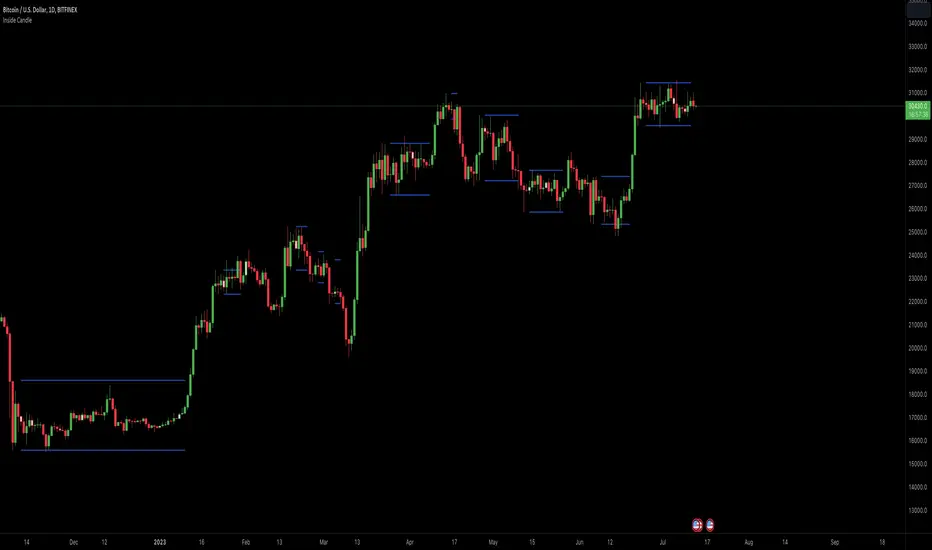
How it works:
- It check for daily close (or the chosen timeframe), highlight inside candles and also plot trading range limits generated by inside pattern
- Trading range limits extend until candle closes are within those limits
- Usually the longer the trading range last, the stronger the following trend is when it break in any direction
Settings:
- Change color of inside bars and enable/disable from chart
- Change color of trading range and enable/disable from chart
Alerts:
- No alerts are defined at the moment
What it’s meant for:
- This indicator is used to identify inside candles that might generate an upcoming trading range
- Works best on large timeframe (Suggested from 2 days up to 1 week) and crypto asset (Index don't show much because of daily gaps)
How it works:
- It check for daily close (or the chosen timeframe), highlight inside candles and also plot trading range limits generated by inside pattern
- Trading range limits extend until candle closes are within those limits
- Usually the longer the trading range last, the stronger the following trend is when it break in any direction
Settings:
- Change color of inside bars and enable/disable from chart
- Change color of trading range and enable/disable from chart
Alerts:
- No alerts are defined at the moment
Release Notes
Updated chartRelease Notes
- added timeframe selector: as in the shown chart you can be on a daily chart and force a 2 days inside range calculationOpen-source script
In true TradingView spirit, the creator of this script has made it open-source, so that traders can review and verify its functionality. Kudos to the author! While you can use it for free, remember that republishing the code is subject to our House Rules.
Disclaimer
The information and publications are not meant to be, and do not constitute, financial, investment, trading, or other types of advice or recommendations supplied or endorsed by TradingView. Read more in the Terms of Use.
Open-source script
In true TradingView spirit, the creator of this script has made it open-source, so that traders can review and verify its functionality. Kudos to the author! While you can use it for free, remember that republishing the code is subject to our House Rules.
Disclaimer
The information and publications are not meant to be, and do not constitute, financial, investment, trading, or other types of advice or recommendations supplied or endorsed by TradingView. Read more in the Terms of Use.