OPEN-SOURCE SCRIPT
Updated ZigZag with Fibonacci Levels
Hello Traders,
This is "ZigZag with Fibonacci Levels" script. It finds the ZigZag, draw Fibonacci lines and put labels accordingly. I get many requests for this script, so here it is.
You can set ZigZag period as you wish. Bigger numbers (such 20, 30) may give better perspective and result.
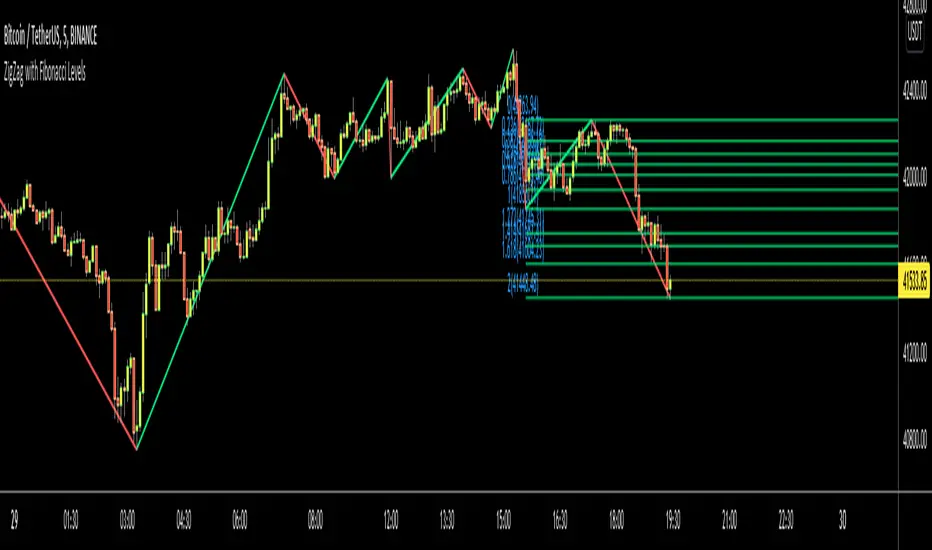
It draws Fibonacci levels between 0%-100% and If the price goes higher/lower than 100% level than the script draws Fibonacci Levels accordingly. This means it draws Fibonacci levels until this levels get higher/lower than the price.
As an example:

if you don't want to see ZigZag Lines then you have option to disable it and see only Fibonacci levels:

You have coloring options for Zigzag, Fibonacci lines and texts:

Enjoy!
This is "ZigZag with Fibonacci Levels" script. It finds the ZigZag, draw Fibonacci lines and put labels accordingly. I get many requests for this script, so here it is.
You can set ZigZag period as you wish. Bigger numbers (such 20, 30) may give better perspective and result.
It draws Fibonacci levels between 0%-100% and If the price goes higher/lower than 100% level than the script draws Fibonacci Levels accordingly. This means it draws Fibonacci levels until this levels get higher/lower than the price.
As an example:
if you don't want to see ZigZag Lines then you have option to disable it and see only Fibonacci levels:
You have coloring options for Zigzag, Fibonacci lines and texts:
Enjoy!
Release Notes
Added Price Levels to the labels.Release Notes
- You have now option to enable/disable following Fibonnaci Levels:---> 0.236
---> 0.382
---> 0.500
---> 0.618
---> 0.786
- "Label Location" option added. Fibonacci levels can be shown at Left or Right. when the session is closed then labels at right may not be shown accordingly.
An example: some fibonacci levels disabled, also labeling at right.
Release Notes
Options improvedZigzag part improved
round_to_mintick() function used
bar_index is used for labels (instead of time)
Release Notes
updatedOpen-source script
In true TradingView spirit, the creator of this script has made it open-source, so that traders can review and verify its functionality. Kudos to the author! While you can use it for free, remember that republishing the code is subject to our House Rules.
Our official telegram channel is t.me/+nOh3yWZOYINlOWIy
Disclaimer
The information and publications are not meant to be, and do not constitute, financial, investment, trading, or other types of advice or recommendations supplied or endorsed by TradingView. Read more in the Terms of Use.
Open-source script
In true TradingView spirit, the creator of this script has made it open-source, so that traders can review and verify its functionality. Kudos to the author! While you can use it for free, remember that republishing the code is subject to our House Rules.
Our official telegram channel is t.me/+nOh3yWZOYINlOWIy
Disclaimer
The information and publications are not meant to be, and do not constitute, financial, investment, trading, or other types of advice or recommendations supplied or endorsed by TradingView. Read more in the Terms of Use.