OPEN-SOURCE SCRIPT
50,100,200,350 MA
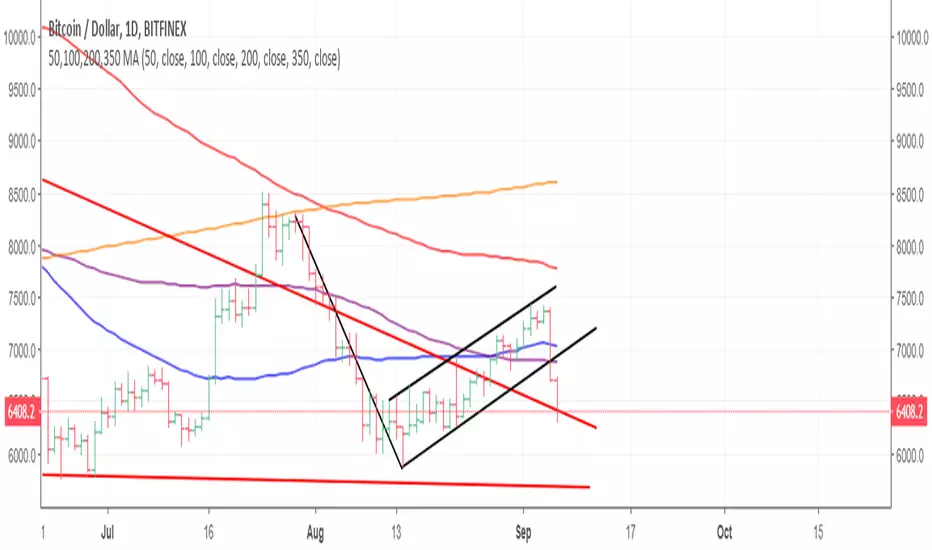
This will display the 50, 100 & 200 moving average (MA) on your charts (also known as Simply Moving Average). When looking at these on a daily chart the 350ma is a representation of the 50 week moving average.
Hope this helps
Good Luck
Simon McCabe
Twitter: @simoncmccabe
Hope this helps
Good Luck
Simon McCabe
Twitter: @simoncmccabe
Open-source script
In true TradingView spirit, the creator of this script has made it open-source, so that traders can review and verify its functionality. Kudos to the author! While you can use it for free, remember that republishing the code is subject to our House Rules.
Disclaimer
The information and publications are not meant to be, and do not constitute, financial, investment, trading, or other types of advice or recommendations supplied or endorsed by TradingView. Read more in the Terms of Use.