OPEN-SOURCE SCRIPT
Trend Analyzer
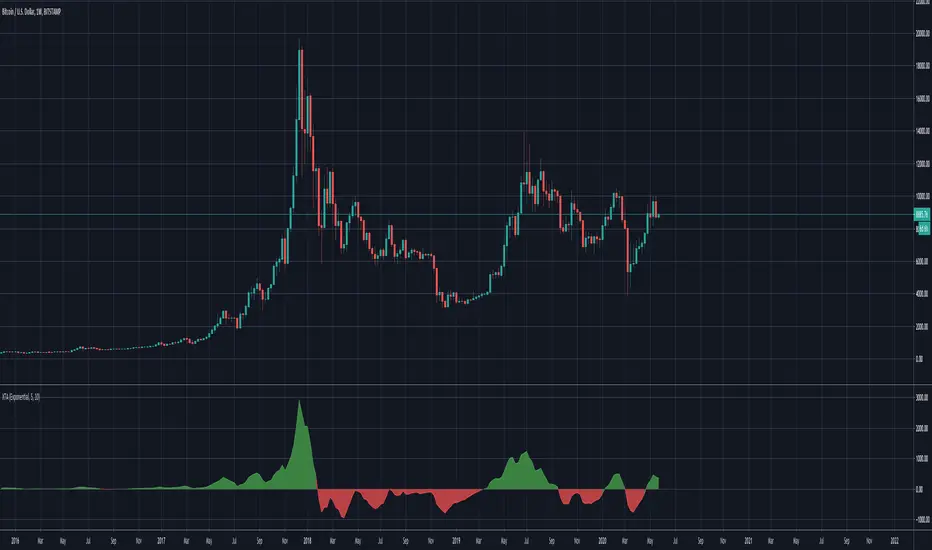
A simple script that plots difference between 2 moving averages and depicts convergance/divergance in color coded format.
Anything <= 0 is red and shows a bearish trend whereas > 0 is green and shows bullish trend.
Adjust the input parameters as following for your preferred time frame :
Anything <= 0 is red and shows a bearish trend whereas > 0 is green and shows bullish trend.
Adjust the input parameters as following for your preferred time frame :
- 4-Hr: Exponential, 15, 30
- Daily: Exponential, 10, 20
- Weekly: Exponential, 5, 10
Open-source script
In true TradingView spirit, the creator of this script has made it open-source, so that traders can review and verify its functionality. Kudos to the author! While you can use it for free, remember that republishing the code is subject to our House Rules.
Disclaimer
The information and publications are not meant to be, and do not constitute, financial, investment, trading, or other types of advice or recommendations supplied or endorsed by TradingView. Read more in the Terms of Use.