OPEN-SOURCE SCRIPT
Updated Exponential Deviation Bands [ChuckBanger]
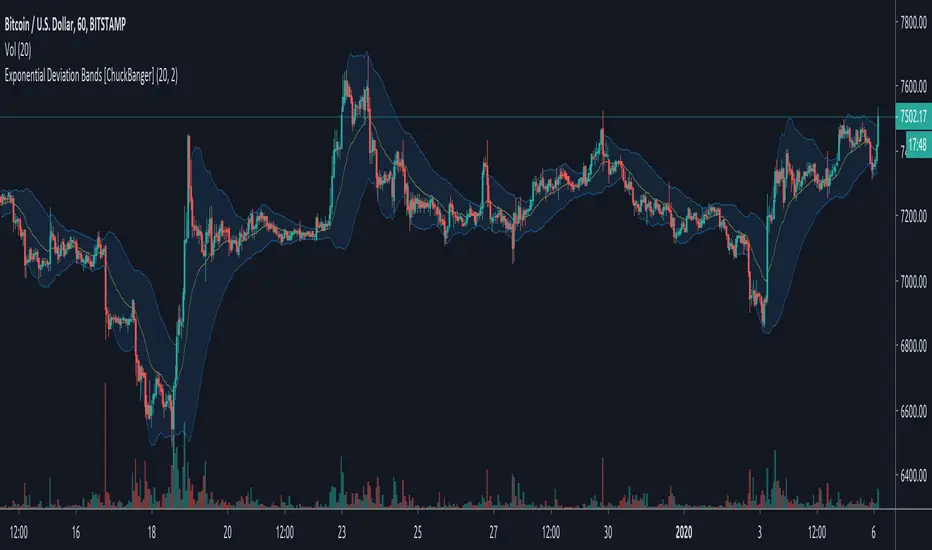
This is Exponential Deviation Bands. It is a price band indicator based on exponential deviation rather than the more traditional standard deviation, as you find in the well-known Bollinger Bands calculation. As compared to standard deviation bands, exponential deviation bands apply more weight to recent data and generate fewer breakouts. There fore it is a much better tool to identifying trends.
One strategy on the daily can be
One strategy on the daily can be
- Buy next bar if closing price crosses below the lower bands
- Sell if price is equal to the current value of the upper bands
Release Notes
Fixed a typing error so the multiple can be a float. And not only an integerRelease Notes
Just updating the screenshot Open-source script
In true TradingView spirit, the creator of this script has made it open-source, so that traders can review and verify its functionality. Kudos to the author! While you can use it for free, remember that republishing the code is subject to our House Rules.
Tip jar, if you want to support my indicators work
BTC: 3EV8QGKK689kToo1r8pZJXbWDqzyJQtHy6
LTC: LRAikFVtnqY2ScJUR2ETJSG4w9t8LcmSdh
BTC: 3EV8QGKK689kToo1r8pZJXbWDqzyJQtHy6
LTC: LRAikFVtnqY2ScJUR2ETJSG4w9t8LcmSdh
Disclaimer
The information and publications are not meant to be, and do not constitute, financial, investment, trading, or other types of advice or recommendations supplied or endorsed by TradingView. Read more in the Terms of Use.
Open-source script
In true TradingView spirit, the creator of this script has made it open-source, so that traders can review and verify its functionality. Kudos to the author! While you can use it for free, remember that republishing the code is subject to our House Rules.
Tip jar, if you want to support my indicators work
BTC: 3EV8QGKK689kToo1r8pZJXbWDqzyJQtHy6
LTC: LRAikFVtnqY2ScJUR2ETJSG4w9t8LcmSdh
BTC: 3EV8QGKK689kToo1r8pZJXbWDqzyJQtHy6
LTC: LRAikFVtnqY2ScJUR2ETJSG4w9t8LcmSdh
Disclaimer
The information and publications are not meant to be, and do not constitute, financial, investment, trading, or other types of advice or recommendations supplied or endorsed by TradingView. Read more in the Terms of Use.