OPEN-SOURCE SCRIPT
Seasons
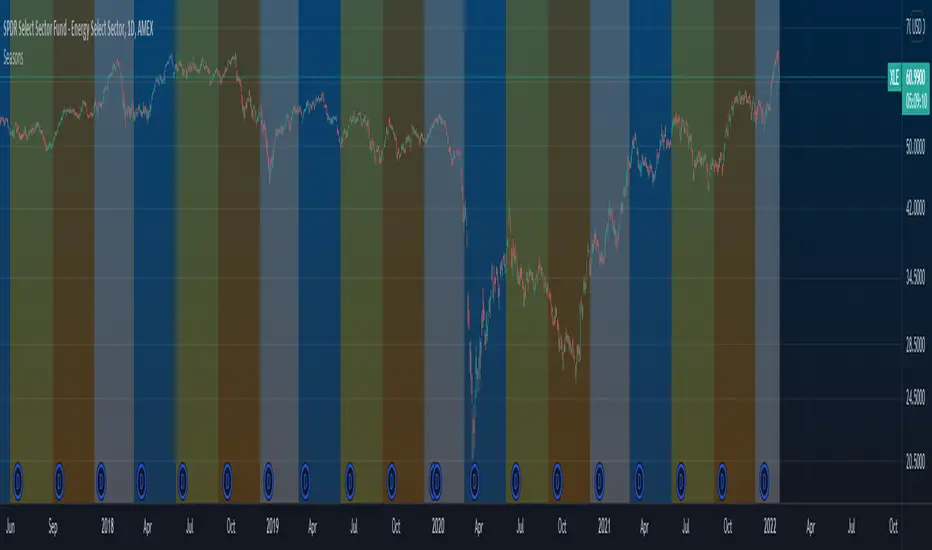
Seasons Indicator
What does this show?
What does this show?
- This indicator shows the individual seasons to plot on a chart to see how an asset has performed historically during certain seasons.
- Orange => Fall
- White => Winter
- Blue => Spring
- Yellow => Summer
Open-source script
In true TradingView spirit, the creator of this script has made it open-source, so that traders can review and verify its functionality. Kudos to the author! While you can use it for free, remember that republishing the code is subject to our House Rules.
Disclaimer
The information and publications are not meant to be, and do not constitute, financial, investment, trading, or other types of advice or recommendations supplied or endorsed by TradingView. Read more in the Terms of Use.