OPEN-SOURCE SCRIPT
Updated Horizontal Lines from Current Price
This indicator will help traders track price fluctuations in smaller time frames more conveniently than ever before.
Here's how it works:
Additionally, we also provide volume display (measured in USD) at the current candle position to assist traders in keeping track of market momentum more closely.
Installation guide for indicators:
Here's how it works:
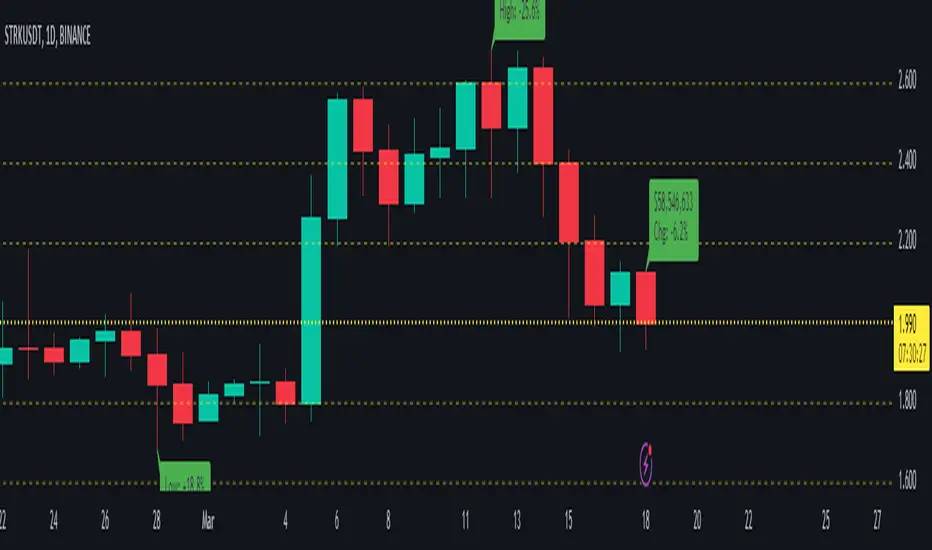
Starting from the current price, the indicator will draw horizontal lines spaced 10% apart.
Now, whenever zooming in or out of the chart, traders can visually determine the level of price volatility more easily.
Additionally, we also provide volume display (measured in USD) at the current candle position to assist traders in keeping track of market momentum more closely.
Installation guide for indicators:
After installing the indicator, make sure that the indicator is merged with the price chart.
Secondly, ensure that the scale bar of the indicator merges with the scale bar of the price chart.
Release Notes
Update default inputsRelease Notes
Clean source code & InputsRelease Notes
➕ Added the feature to view the highest and lowest price changes of the current bar compared to the previous bars.⚡⚡⚡Release Notes
Clean source code 🚧🚧🚧Release Notes
➕ Added the feature to view the changes in the current price bar.⚡⚡⚡Release Notes
Clean source code 🚧🚧🚧Release Notes
Update display current price 🚧🚧🚧Release Notes
Fix bug 🚧🚧🚧Release Notes
Fix bug 🚧🚧🚧Release Notes
Fix bug 🚧🚧🚧Release Notes
Fix bug 🚧🚧🚧Release Notes
Fix bug 🚧🚧🚧Release Notes
Fix bug 🚧🚧🚧Release Notes
Fix bug 🚧🚧🚧Open-source script
In true TradingView spirit, the creator of this script has made it open-source, so that traders can review and verify its functionality. Kudos to the author! While you can use it for free, remember that republishing the code is subject to our House Rules.
Disclaimer
The information and publications are not meant to be, and do not constitute, financial, investment, trading, or other types of advice or recommendations supplied or endorsed by TradingView. Read more in the Terms of Use.
Open-source script
In true TradingView spirit, the creator of this script has made it open-source, so that traders can review and verify its functionality. Kudos to the author! While you can use it for free, remember that republishing the code is subject to our House Rules.
Disclaimer
The information and publications are not meant to be, and do not constitute, financial, investment, trading, or other types of advice or recommendations supplied or endorsed by TradingView. Read more in the Terms of Use.