OPEN-SOURCE SCRIPT
Moving Average Convergence Divergence and Momentum
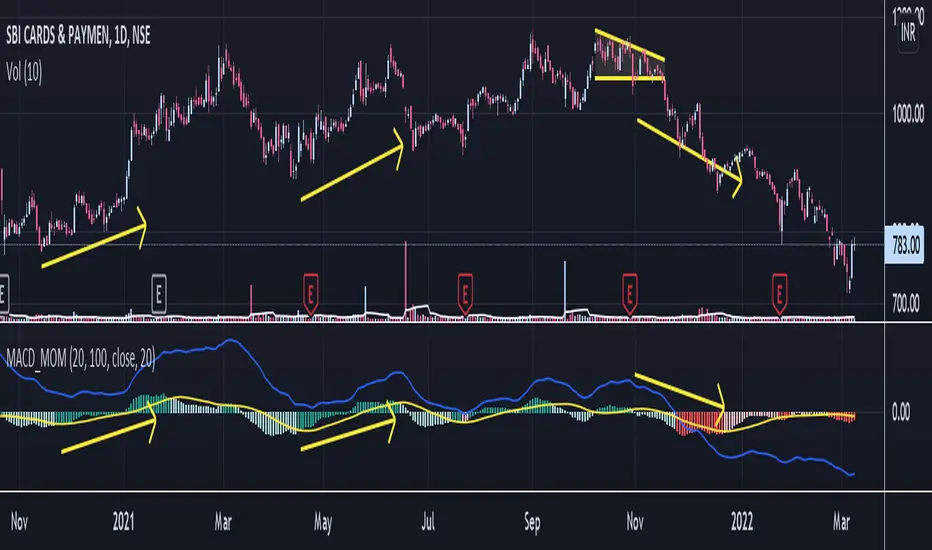
MACD line is difference between 20 EMA and 100 EMA which measures the Longterm trend. If MACD line is above Zero trend is positive. If MACD line is below zero trend is negative. Strategy is classic Buy in uptrend Sell in Downtrend.
To Improve the entry timing MACD histogram is used as Momentum. Histogram is the difference between MACD line and 20 EMA of MACD line. And Hist Momentum is the 20 SMA of histogram.
Advantage of histogram is Smoothness and better reliability than other momentum indicators like RSI which is volatile.
If MACD line is above zero = Trend is positive
and Histogram is above its SMA = Momentum is also positive.
Buy Signal.
If MACD line is above zero = Trend is positive
and Histogram is below its SMA = Trend is positive but Momentum is losing.
Look for Support levels or Break out of support level.
If MACD line is below zero = Trend is Negative
and Histogram is Below its SMA = Momentum is also Negative.
Sell Signal.
If MACD line is Below zero = Trend is Negative
and Histogram is above its SMA = Trend is negative but momentum is improving
Look for Resistance levels or Break out of resistance level.
Open-source script
In true TradingView spirit, the creator of this script has made it open-source, so that traders can review and verify its functionality. Kudos to the author! While you can use it for free, remember that republishing the code is subject to our House Rules.
Disclaimer
The information and publications are not meant to be, and do not constitute, financial, investment, trading, or other types of advice or recommendations supplied or endorsed by TradingView. Read more in the Terms of Use.