OPEN-SOURCE SCRIPT
DCF Approximation
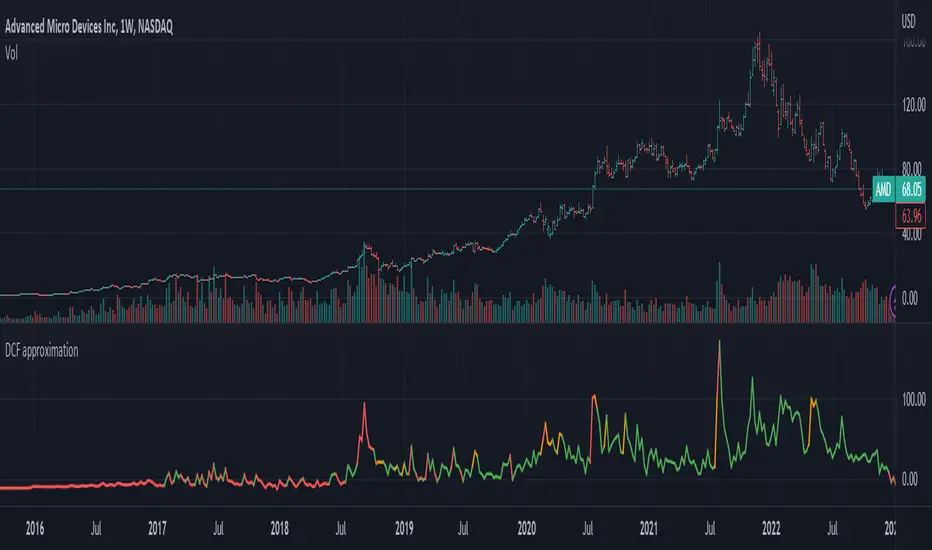
The indicator for calculating and visualizing the Discounted Cash Flow (DCF) for a selected stock.
It uses the Weighted Average Cost of Capital (WACC) with a margin of safety and the Free Cash Flow (FCF) calculation for cash flow analysis. The DCF is calculated by summing the discounted annual FCFs over a 10-year period.
The chart color depends on the value of the current price percentage - it turns red when the market price is over valuation, yellow around a fair value, and green for the price under valuation.
This is an early version of the indicator, so I would appreciate your suggestions for improving the code and formulas.
Open-source script
In true TradingView spirit, the creator of this script has made it open-source, so that traders can review and verify its functionality. Kudos to the author! While you can use it for free, remember that republishing the code is subject to our House Rules.
Disclaimer
The information and publications are not meant to be, and do not constitute, financial, investment, trading, or other types of advice or recommendations supplied or endorsed by TradingView. Read more in the Terms of Use.