OPEN-SOURCE SCRIPT
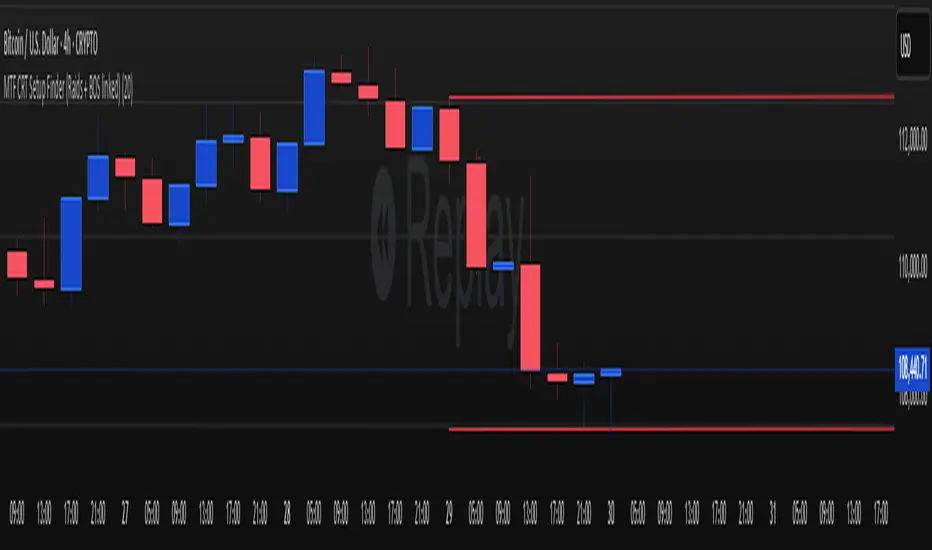
MTF CRT Setup Finder (Raids + BOS linked)

//version=6
indicator("MTF CRT Setup Finder (Raids + BOS linked)", overlay=true, max_lines_count=500)
// === INPUTS ===
lookback = input.int(5, "Swing Lookback Bars", minval=2)
// === Function: Detect swing highs/lows ===
swingHigh(src, lb) => ta.pivothigh(src, lb, lb)
swingLow(src, lb) => ta.pivotlow(src, lb, lb)
// === Function: Detect CRT with memory ===
f_crt(tf) =>
hi = request.security(syminfo.tickerid, tf, high)
lo = request.security(syminfo.tickerid, tf, low)
cl = request.security(syminfo.tickerid, tf, close)
sh = request.security(syminfo.tickerid, tf, swingHigh(high, lookback))
sl = request.security(syminfo.tickerid, tf, swingLow(low, lookback))
raidHigh = not na(sh) and hi > sh and cl < sh
raidLow = not na(sl) and lo < sl and cl > sl
// store last raid state
var bool hadRaidHigh = false
var bool hadRaidLow = false
if raidHigh
hadRaidHigh := true
if raidLow
hadRaidLow := true
bosDown = hadRaidHigh and cl < sl
bosUp = hadRaidLow and cl > sh
// reset after BOS
if bosDown
hadRaidHigh := false
if bosUp
hadRaidLow := false
[raidHigh, raidLow, bosUp, bosDown]
// === Apply on H1 only first (test) ===
[raidHigh, raidLow, bosUp, bosDown] = f_crt("60")
// === Plot ===
plotshape(raidHigh, title="Raid High", style=shape.diamond, color=color.red, size=size.small, text="Raid High")
plotshape(raidLow, title="Raid Low", style=shape.diamond, color=color.green, size=size.small, text="Raid Low")
plotshape(bosDown, title="Bearish CRT", style=shape.triangledown, color=color.red, size=size.large, text="CRT↓")
plotshape(bosUp, title="Bullish CRT", style=shape.triangleup, color=color.green, size=size.large, text="CRT↑")
Open-source script
In true TradingView spirit, the creator of this script has made it open-source, so that traders can review and verify its functionality. Kudos to the author! While you can use it for free, remember that republishing the code is subject to our House Rules.
Disclaimer
The information and publications are not meant to be, and do not constitute, financial, investment, trading, or other types of advice or recommendations supplied or endorsed by TradingView. Read more in the Terms of Use.