PROTECTED SOURCE SCRIPT
EMA MAGIC BAND
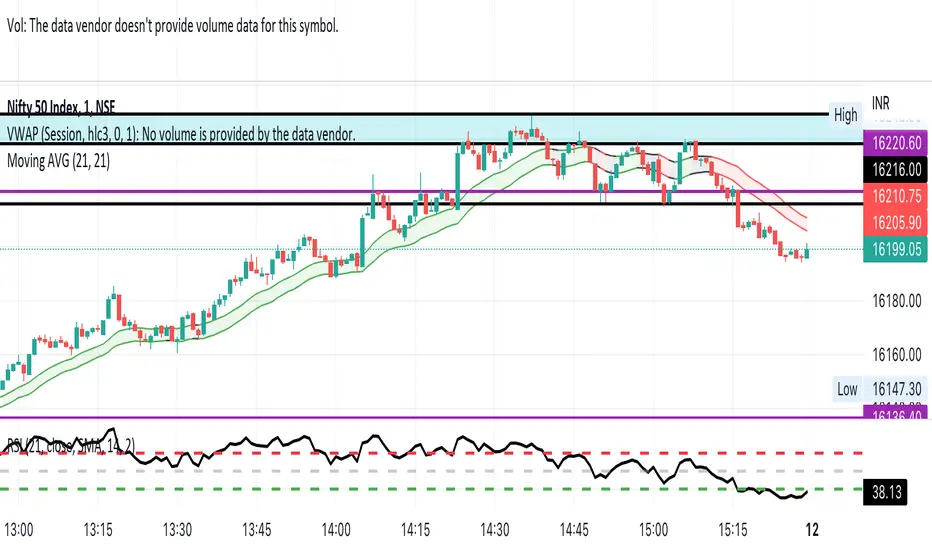
This is the 21 EMA Band Which follows the chart for the last 21 Average High and Low Prices of the Candle with Integrated RSI. This is a Colourful Band When Market is in Uptrend it shows Green, Market is Downtrend it shows Red and When Sideways Black.
Protected script
This script is published as closed-source. However, you can use it freely and without any limitations – learn more here.
Disclaimer
The information and publications are not meant to be, and do not constitute, financial, investment, trading, or other types of advice or recommendations supplied or endorsed by TradingView. Read more in the Terms of Use.