GoldenCO Aie3
This gco3 strategy uses exponential moving average analysis which is 5emas to show the movement of stock prices in the market. It is also to track the impending changes to the market price. the use of EMA is more sensitive to trend changes and it is one way to see the trend of price movements and as a guide to the trader.
The parameters used are EMA5/EMA20/EMA50/EMA100/EMA200.
The above parameters indicate a price condition that includes 4 phases of the price trend, namely the accumulation, uptrend, distribution, and ddowntrend phases.
we hope that, by recognizing and knowing the trend of this price movement it can help traders in trading activities well and can reduce risk. May it benefit the trader.
DISCLAIMER ; This is not Buy/Sell call, Just analysis idea for education. Trade At Your Own Risk
INSTRUMENT>
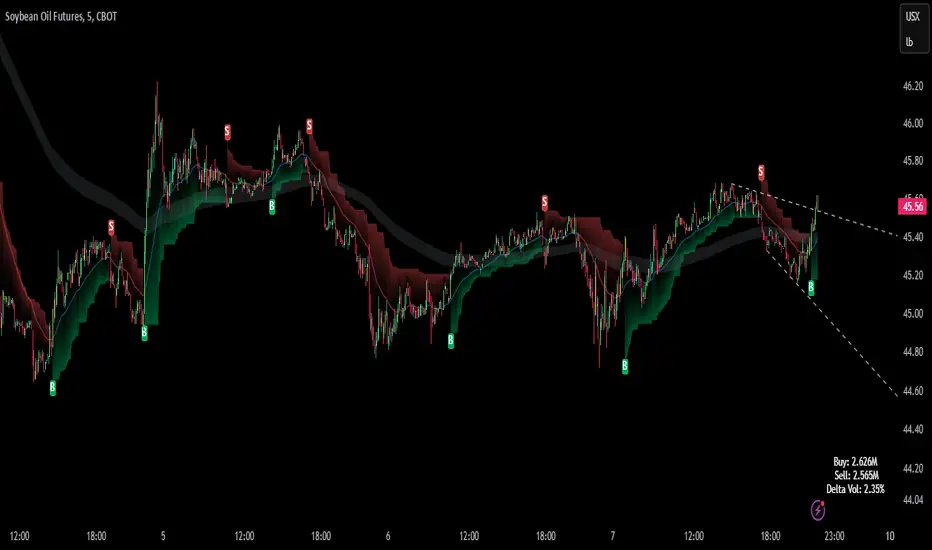
1) Bar colored- to define a trend whether bullish(green) or bearish(red).
2) Background- blue color=price above ema20, red color=price below ema20.
3) The B lime signal has been updated with parameters that are ema5 cross over ema50. it is to get a strong signal for the trend.
ALERT CONDITION>
Now traders can create alerts for conditions in the setting. You can select the types of conditions and where notifications will be sent.
1. update to version 5 script
2. New perimeter for exponential moving average.
3. added value to bull & bear trend strategies based on pivot points.
This reorganization is to increase the effectiveness of the EMA strategy and its accessibility to all types of markets and time frames. Parameters and strategies can be used for all markets including the stock market except the exchange.
The chart below is how the strategy uses signals and plots,
FCPO, 3 minutes
How to avoids a false signals
1. Refers biggest/mother trends such as 1 hour or 30 minutes, then entries at smallest should
be follows the biggest/mother
2. identify the supply and demand zones to see the suitability of the position, open buy/sell
zones or taking/exit zones.
*refer to the chart above, we can see that’s why the hitting TP’s ( should be ) was happen
between 11 ticks to 48 ticks, based on supply & demand and trends condition.
see, the signal difference at 5 minutes and 3 minutes,
5m = more clear trend
3m = there are 3 false signals, 6 hits TP
the solution;
if the small trend moves horizontally, or is not clear, or the price movement is close to the Bold EMA (grey plot) so we refer to the larger time frame as a guide.
We can avoid 3 false in 3m earlier if we refer to 5m or above.
BTCUSD 5m
BTCUSD 3m
ETHUSD 3m
SOY OIL 10m
CRUDE OIL 15m
BURSA STOCKS 5m scalping/intraday
BURSA STOCKS daily TF swing
Customize a style and create an alert/notification
avg_volume_delta = (up_trend_volume + down_trend_volume) / 2
delta Volume percentage = up_trend_volume - down_trend_volume) /
avg_volume_delta.
Use of average volume delta = to see the difference/strength of buyers and
sellers throughout the trend, which is based on the percentage of average
net volume.
major bull/bear trend strategies
How to do if the trends/signals in the small timeframe are not clear/sideways movement
minimize lighting, so it's neater/less distracting,
change signal shape,
replace volume label to bottom,
Invite-only script
Only users approved by the author can access this script. You'll need to request and get permission to use it. This is typically granted after payment. For more details, follow the author's instructions below or contact TraderAsist directly.
TradingView does NOT recommend paying for or using a script unless you fully trust its author and understand how it works. You may also find free, open-source alternatives in our community scripts.
Author's instructions
Disclaimer
Invite-only script
Only users approved by the author can access this script. You'll need to request and get permission to use it. This is typically granted after payment. For more details, follow the author's instructions below or contact TraderAsist directly.
TradingView does NOT recommend paying for or using a script unless you fully trust its author and understand how it works. You may also find free, open-source alternatives in our community scripts.