PROTECTED SOURCE SCRIPT
Pulse Flow
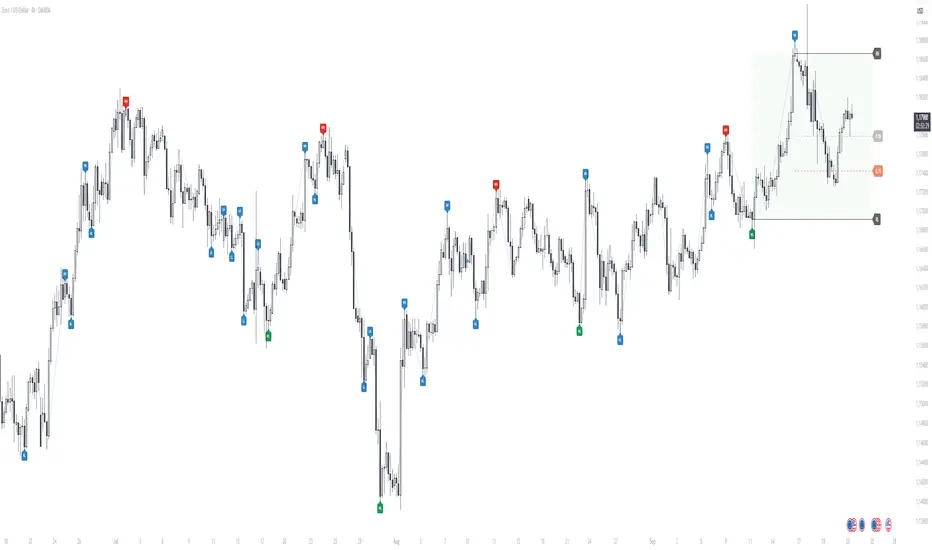
Pulse Flow is a market structure indicator that extracts the hidden rhythm of price. It combines micro-structure detection with a rule-based trend engine, making waves and turning points visible in real time. Instead of drawing swings by hand or guessing breakouts, Pulse Flow enforces strict, objective rules for what counts as structure.
What it shows

How it helps
Pulse Flow helps traders by taking the guesswork out of structure. Instead of debating whether a high or low should count, the indicator applies objective rules and marks every confirmed swing directly on the chart. Each wave is highlighted the moment the trend flips, so you always see where the market has turned and which direction the active wave is heading. The internal fractal structure reveals how price moves within the range, while the explicit HH, HL, LH, and LL points define the external trend. This distinction allows you to make tactical decisions on internal breaks and strategic decisions on external breaks, giving you clarity across timeframes. Because ranges are calculated using closing prices, the levels remain stable even when liquidity sweeps occur, making the indicator reliable in volatile markets. Combined with automatically plotted retracement levels, you gain a consistent framework for spotting likely reaction zones without redrawing lines or relying on subjective judgment.
How it works
Under the hood, Pulse Flow combines two engines. The pivot engine extracts micro swings by tracking how price crosses a baseline, which can be either EMA or ALMA, depending on your settings. Each cross defines a candidate high or low, and together these pivots form the fractal zigzag that represents the market’s micro-structure. On top of this, a finite state machine manages the active range. It tracks the range high and range low, validates breakouts only when price closes beyond these levels with ATR-based confirmation, and waits for a pullback before locking in the new structure. When the FSM confirms a new trend, Pulse Flow explicitly marks the turning point as a wave high or wave low. In this way, every confirmed HH, HL, LH, and LL is not a guess but the logical outcome of strict structural rules. The interaction between pivots and the FSM creates a complete and consistent map of the market’s waves, from micro oscillations to macro trend shifts.
Summary
Pulse Flow extracts micro-structure, defines waves, and highlights turning points. It shows the active range with key retracement levels and confirms breakouts with ATR + candle logic. By using closing prices to define RL/RH, it stays consistent even through liquidity sweeps.
For traders who trade based on structure, Pulse Flow is not just another tool. It is a framework: a rule-based map of how markets actually move in waves.
What it shows
- Micro-Structure (Fractals): Internal swings are extracted from baseline crosses (EMA or ALMA). These fractals show how price oscillates inside the wave, providing context for micro pullbacks and internal breaks.
- Trend (HH, HL, LH, LL): Pulse Flow uses a finite state machine (FSM) to track the current trend. Every trend represents a wave.
- Confirmed higher highs and higher lows define bullish waves.
- Confirmed lower highs and lower lows define bearish waves.
- When a wave breaks, a new wave begins. Turning points are explicitly marked as WH (wave high) and WL (wave low). - Active Range (RL & RH): The indicator continuously maintains the current range, based on closing prices rather than wicks. This ensures consistent behavior during liquidity events, where extremes are often tested intrabar.
- Retracement Levels (0.50 & 0.71): Inside each active range, Pulse Flow plots the midrange and the 0.71 “optimal entry zone,” highlighting areas where pullbacks most often react.
- Breakout Confirmation: A breakout is only valid if:
- The close extends beyond RL or RH by at least an ATR-based threshold.
- A second candle confirms the move.
This filters false signals and ensures structural integrity.
How it helps
Pulse Flow helps traders by taking the guesswork out of structure. Instead of debating whether a high or low should count, the indicator applies objective rules and marks every confirmed swing directly on the chart. Each wave is highlighted the moment the trend flips, so you always see where the market has turned and which direction the active wave is heading. The internal fractal structure reveals how price moves within the range, while the explicit HH, HL, LH, and LL points define the external trend. This distinction allows you to make tactical decisions on internal breaks and strategic decisions on external breaks, giving you clarity across timeframes. Because ranges are calculated using closing prices, the levels remain stable even when liquidity sweeps occur, making the indicator reliable in volatile markets. Combined with automatically plotted retracement levels, you gain a consistent framework for spotting likely reaction zones without redrawing lines or relying on subjective judgment.
How it works
Under the hood, Pulse Flow combines two engines. The pivot engine extracts micro swings by tracking how price crosses a baseline, which can be either EMA or ALMA, depending on your settings. Each cross defines a candidate high or low, and together these pivots form the fractal zigzag that represents the market’s micro-structure. On top of this, a finite state machine manages the active range. It tracks the range high and range low, validates breakouts only when price closes beyond these levels with ATR-based confirmation, and waits for a pullback before locking in the new structure. When the FSM confirms a new trend, Pulse Flow explicitly marks the turning point as a wave high or wave low. In this way, every confirmed HH, HL, LH, and LL is not a guess but the logical outcome of strict structural rules. The interaction between pivots and the FSM creates a complete and consistent map of the market’s waves, from micro oscillations to macro trend shifts.
Summary
Pulse Flow extracts micro-structure, defines waves, and highlights turning points. It shows the active range with key retracement levels and confirms breakouts with ATR + candle logic. By using closing prices to define RL/RH, it stays consistent even through liquidity sweeps.
For traders who trade based on structure, Pulse Flow is not just another tool. It is a framework: a rule-based map of how markets actually move in waves.
Protected script
This script is published as closed-source. However, you can use it freely and without any limitations – learn more here.
Disclaimer
The information and publications are not meant to be, and do not constitute, financial, investment, trading, or other types of advice or recommendations supplied or endorsed by TradingView. Read more in the Terms of Use.