OPEN-SOURCE SCRIPT
NASDAQ Trading System with Pivots
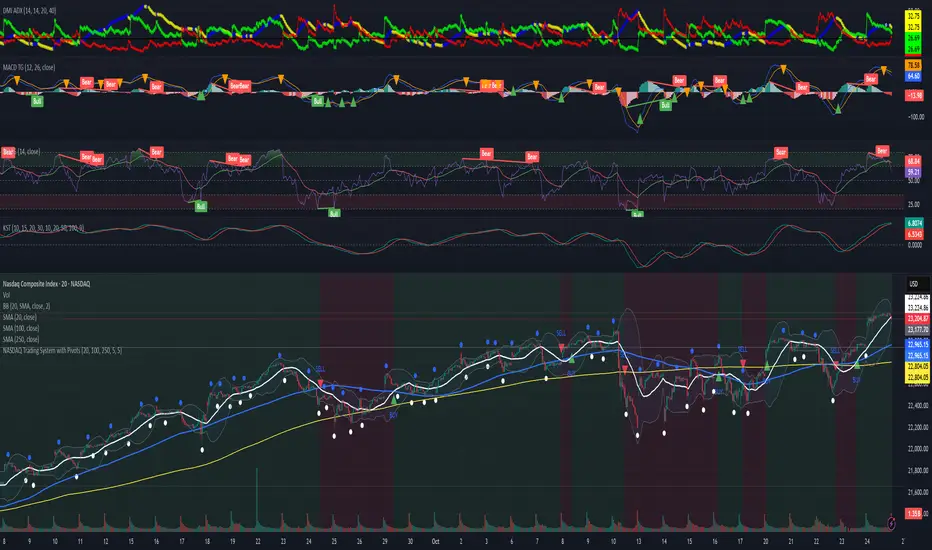
This TradingView indicator, designed for the 30-minute NASDAQ (^IXIC) chart, guides QQQ options trading using a trend-following strategy. It plots a 20-period SMA (blue) and a 100-period SMA (red), with an optional 250-period SMA (orange) inspired by rauItrades' NASDAQ SMA outfit. A bullish crossover (20 SMA > 100 SMA) triggers a green "BUY" triangle below the bar, signaling a potential long position in QQQ, while a bearish crossunder (20 SMA < 100 SMA) shows a red "SELL" triangle above, indicating a short or exit. The background colors green (bullish) or red (bearish) for trend bias. Orange circles (recent highs) and purple circles (recent lows) mark support/resistance levels using 5-bar pivot points.
Open-source script
In true TradingView spirit, the creator of this script has made it open-source, so that traders can review and verify its functionality. Kudos to the author! While you can use it for free, remember that republishing the code is subject to our House Rules.
Disclaimer
The information and publications are not meant to be, and do not constitute, financial, investment, trading, or other types of advice or recommendations supplied or endorsed by TradingView. Read more in the Terms of Use.