PROTECTED SOURCE SCRIPT
Updated Multi-Anchor VWAP Deviation Dashboard
Overview
Multi-Anchor VWAP Deviation Dashboard (Optimized Global) is an overlay indicator that computes up to five user-defined Anchored Volume Weighted Average Prices (AVWAPs) from custom timestamps, plotting their lines and displaying real-time percentage deviations from the current close. It enables precise analysis of price positioning relative to key events (e.g., earnings, news) or periods (e.g., weekly opens), with a compact dashboard for quick scans. Optimized for performance, it uses manual iterative calculations to handle dynamic anchor changes without repainting.
Core Mechanics
The indicator focuses on efficient AVWAP computation and deviation tracking:
Anchor Configuration: Five independent anchors, each with a name, UTC timestamp (e.g., "01 Oct 2025 00:00" for monthly open), show toggle, and color. Timestamps define the calculation start—e.g., AVWAP1 from "20 Oct 2025" onward.
AVWAP Calculation: For each enabled anchor, it identifies the first bar at/after the timestamp as the reset point, then iteratively accumulates (price * volume) / total volume from there. Uses HLC3 source (customizable); handles input changes by resetting sums on new anchors.
Deviation Metric: For each AVWAP, computes % deviation = ((close - AVWAP) / AVWAP) * 100—positive = above (potential resistance), negative = below (support).
Visuals: Plots lines (linewidth 1–2, user colors); dashboard (2 columns, 6 rows) shows names (anchor-colored if enabled) and deviations (green >0%, red <0%, gray N/A), positioned user-selectable with text sizing. Updates on last bar for efficiency.
This setup scales deviations across volatilities, aiding multi-period bias assessment.
Why This Adds Value & Originality
Standard VWAPs limit to session anchors (daily/weekly); deviation tools often lack multiples. This isn't a simple mashup: Manual iterative AVWAP (no built-in ta.vwap reliance) ensures dynamic resets on timestamp tweaks—e.g., shift "Event" to FOMC date without recalc lag. The 5-anchor flexibility (arbitrary UTC times) + centralized dashboard (colored deviations at a glance) creates a "global timeline scanner" unique to event-driven trading, unlike rigid multi-VWAP scripts. It streamlines what requires 5 separate indicators, with % normalization for cross-asset comparison (e.g., SPY vs. BTC).
How to Use
Setup: Overlay on chart. Configure anchors (e.g., Anchor1: "Weekly Open" at next Monday 00:00 UTC; enable/show 2–3 for focus). Set source (HLC3 default), position (Top Right), text size (Small).
Interpret Dashboard:
Left Column: Anchor names (e.g., "Monthly Open" in orange).
Right Column: Deviations (e.g., "+1.25%" green = above, bullish exhaustion?).
Scan for confluence (e.g., all >+2% = overbought).
Trading:
Lines: Price near AVWAP = mean reversion; breaks = momentum.
Example: -0.8% below "Event" anchor post-earnings → potential bounce buy.
Use on 1H–D; adjust timestamps via calendar.
Tips: Enable 1–3 anchors to avoid clutter; test on historical events.
Limitations & Disclaimer
AVWAPs reset on anchor bars, potentially lagging mid-period; deviations are % only (add ATR for absolute). Table updates on close (no intrabar). Timestamps must be UTC/future-proof. No alerts/exits—integrate manually. Not advice; backtest deviations on your assets. Past ≠ future. Comments for ideas.
Release Notes
OverviewMulti-Anchor VWAP Deviation Dashboard (Optimized Global with Pinch Detection) is an overlay indicator that computes up to five user-defined Anchored Volume Weighted Average Prices (AVWAPs) from custom timestamps, along with their standard deviation bands for volatility assessment. It plots the lines and bands, displays real-time percentage deviations from the current close to the AVWAPs, and includes optional pinch detection to identify price compression within the bands. This enables precise analysis of price positioning relative to key events (e.g., earnings, news) or periods (e.g., weekly opens), with a compact dashboard for quick scans and potential squeeze signals. Optimized for performance, it uses manual iterative calculations to handle dynamic anchor changes without repainting.
Core Mechanics
The indicator focuses on efficient AVWAP, standard deviation (SD), deviation, and pinch computation:
Anchor Configuration: Five independent anchors, each with a name, UTC timestamp (e.g., 1760918400000 for "20 Oct 2025 00:00 UTC"), show toggle, color, bands toggle, and SD multiplier (default 1.0). Timestamps define the calculation start—e.g., AVWAP1 from a specific event onward.
AVWAP and SD Calculation: For each enabled anchor, it identifies the first bar at/after the timestamp as the reset point, then iteratively accumulates (price * volume), total volume, and (price² * volume) from there. Uses HLC3 source (customizable); computes AVWAP as cumulative (price * volume) / volume, and SD as sqrt(variance) where variance = avg(price²) - AVWAP². Handles input changes by resetting sums on new anchors.
Bands: Upper/lower bands = AVWAP ± (SD * multiplier), providing dynamic support/resistance zones scaled to volatility.
Deviation Metric: For each AVWAP, computes % deviation = ((close - AVWAP) / AVWAP) * 100—positive = above (potential resistance), negative = below (support).
Pinch Detection: Optional feature checks if the current bar's price range (high - low) is below a user-set threshold (% of band width) and absolute deviation <1%, signaling compression (potential for volatility expansion).
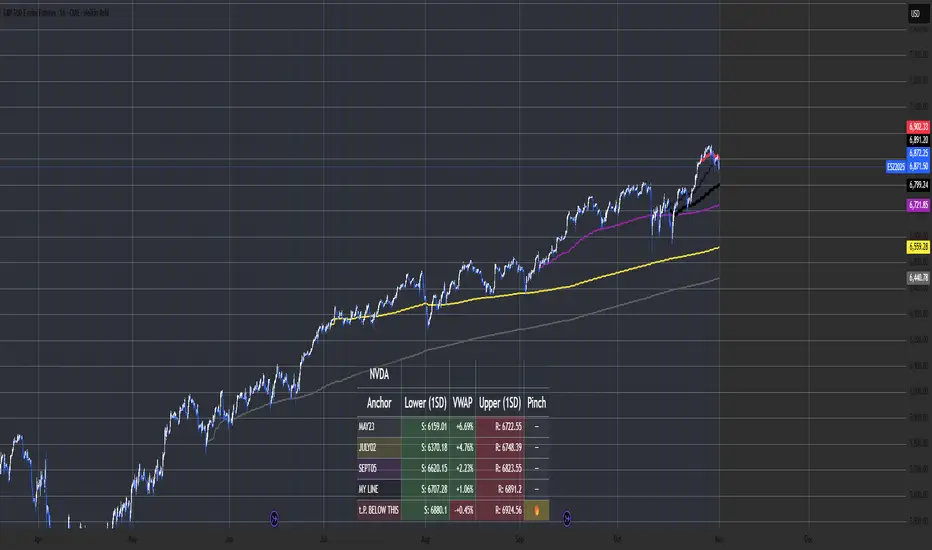
Visuals: Plots AVWAP lines (linewidth 1–2, user colors) and bands (translucent, if enabled); dashboard (4–5 columns, 7 rows) starts with asset name header (user-input, e.g., "NVDA"), then shows anchor names (colored if enabled; appends "(hidden)" if not shown), lower band prices ("S: value" in green), deviations (green >0%, red <0%, gray N/A or "-"), upper band prices ("R: value" in red), and pinch status ("🔥" yellow if detected, "—" otherwise, if enabled). Positioned user-selectable with text sizing. Updates on last bar for efficiency.
This setup scales deviations and bands across volatilities, aiding multi-period bias and squeeze assessment.
Why This Adds Value & Originality
Standard VWAPs limit to session anchors (daily/weekly); deviation tools often lack multiples or volatility bands. This isn't a simple mashup: Manual iterative AVWAP and SD (no built-in ta.vwap reliance) ensures dynamic resets on timestamp tweaks—e.g., shift "Event" to FOMC date without recalc lag. The 5-anchor flexibility (arbitrary UTC times) + bands for support/resistance + pinch detection for compression signals + centralized dashboard (with band prices and squeeze indicators at a glance) creates a "global timeline scanner" unique to event-driven and volatility-based trading, unlike rigid multi-VWAP scripts. It streamlines what requires multiple separate indicators, with % normalization and SD scaling for cross-asset comparison (e.g., SPY vs. BTC).
How to Use
Setup: Overlay on chart. Set asset name (e.g., "NVDA"). Configure anchors (e.g., Anchor1: "Weekly Open" at next Monday 00:00 UTC; enable/show 2–3 for focus; toggle bands and set multiplier). Set source (HLC3 default), position (Top Right), text size (Small). Enable pinch detection and adjust threshold (e.g., 0.25 for tighter squeezes).
Interpret Dashboard:
Top Row: Asset name (e.g., "NVDA").
Column 1: Anchor names (e.g., "Monthly Open" in orange; "(hidden)" if not shown).
Column 2: Lower band prices (green "S: 123.45" if bands shown).
Column 3: Deviations (e.g., "+1.25%" green = above, bullish exhaustion?).
Column 4: Upper band prices (red "R: 456.78" if bands shown).
Column 5 (if pinch enabled): "🔥" yellow = pinch detected (compression near VWAP).
Scan for confluence (e.g., all >+2% = overbought; pinches across anchors = multi-timeframe squeeze).
Trading:
Lines/Bands: Price near AVWAP = mean reversion; breaks = momentum. Bands act as dynamic S/R—e.g., bounce off lower = buy support.
Pinch: "🔥" signals volatility contraction; watch for breakout (e.g., post-pinch expansion → trend continuation).
Example: -0.8% below "Event" AVWAP post-earnings with pinch → potential explosive bounce buy.
Use on 1H–D; adjust timestamps via calendar. Set alerts for pinches (messages like "VWAP Pinch on {{ticker}} - Anchor 1").
Tips: Enable 1–3 anchors/bands to avoid clutter; test on historical events. Adjust SD multiplier for wider/narrower bands (e.g., 2.0 for 2SD). Lower pinch threshold for stricter detection; use with volume for confirmation.
Limitations & Disclaimer
AVWAPs reset on anchor bars, potentially lagging mid-period; deviations are % to AVWAP only (add ATR for absolute); SD assumes Gaussian distribution, may underperform in skewed markets. Bands/pinch require sufficient data post-anchor. Pinch sensitivity depends on threshold—false positives in low-vol assets. Table updates on close (no intrabar). Timestamps must be UTC/future-proof (in ms). Alerts are conditional on shown anchors—no auto exits; integrate manually. Not advice; backtest on your assets. Past ≠ future. Comments for ideas.
Protected script
This script is published as closed-source. However, you can use it freely and without any limitations – learn more here.
Disclaimer
The information and publications are not meant to be, and do not constitute, financial, investment, trading, or other types of advice or recommendations supplied or endorsed by TradingView. Read more in the Terms of Use.