OPEN-SOURCE SCRIPT
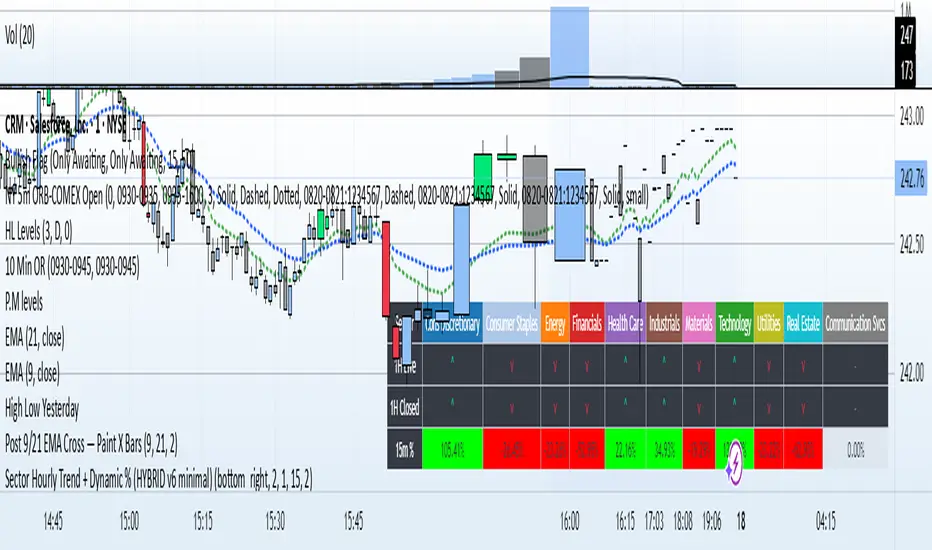
Updated Sector Hourly Trend + Dynamic %

Here’s a concise but clear description you can give to other users:
---
**📊 Sector Hourly Trend + Dynamic % Change Table (Pine Script v6)**
This TradingView indicator displays a fixed on-screen table showing the **real-time performance** of the 11 major SPDR sector ETFs.
**Features:**
* **Hourly Trend Column:** Uses 60-minute candle data to detect the sector’s current direction vs. the previous hour:
* **^** (green) → sector is up over the past hour.
* **v** (red) → sector is down over the past hour.
* **–** (gray) → no change.
* **Dynamic % Change Column:** Calculates the percentage move over a user-defined window (in minutes) using 1-minute data.
* Background colors: bright green for positive, bright red for negative, gray for no change.
* Text color: black for maximum contrast.
* **Sector Column:** Lists each SPDR sector by name, color-coded for easy identification.
* **Customizable Position:** Choose screen corner and fine-tune with X/Y offsets to avoid overlapping the TradingView Pro badge or UI buttons.
* **Always On-Screen:** The table is fixed to the chart’s viewport, so it stays visible regardless of zoom or scroll.
**Use Cases:**
* Quick visual snapshot of which sectors are leading or lagging intraday.
* Monitor short-term sector rotation without switching tickers.
* Combine with your trading strategy to align trades with sector momentum.
Release Notes
I have updated the script so that the user can see the trend of the last 1 hour close in each sector as well as the trend of the current hour.Open-source script
In true TradingView spirit, the creator of this script has made it open-source, so that traders can review and verify its functionality. Kudos to the author! While you can use it for free, remember that republishing the code is subject to our House Rules.
Disclaimer
The information and publications are not meant to be, and do not constitute, financial, investment, trading, or other types of advice or recommendations supplied or endorsed by TradingView. Read more in the Terms of Use.
Open-source script
In true TradingView spirit, the creator of this script has made it open-source, so that traders can review and verify its functionality. Kudos to the author! While you can use it for free, remember that republishing the code is subject to our House Rules.
Disclaimer
The information and publications are not meant to be, and do not constitute, financial, investment, trading, or other types of advice or recommendations supplied or endorsed by TradingView. Read more in the Terms of Use.