OPEN-SOURCE SCRIPT
Blended Candles
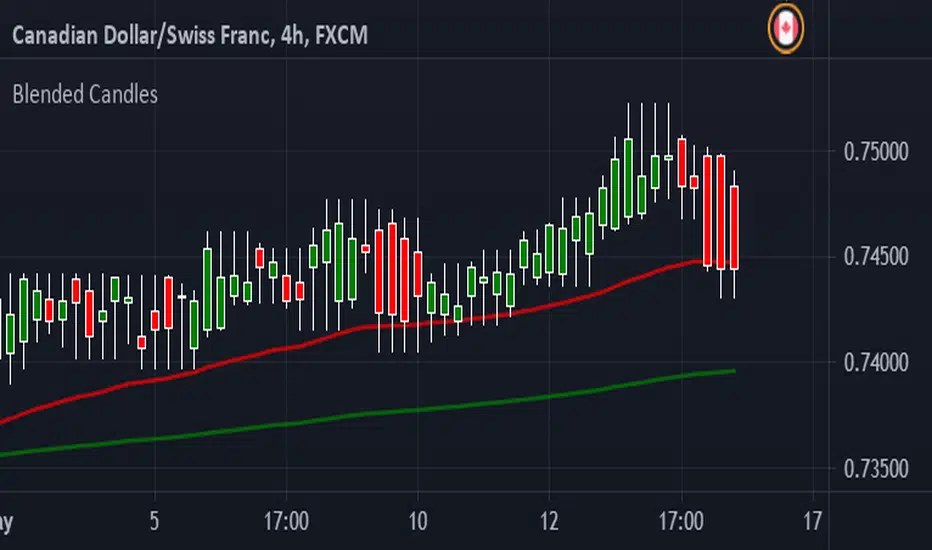
Have been looking at YouTube and found a few videos about Blended Candles. Couldn't find a script here so I decided to script something myself.
I have also added a couple of EMA's, saves having to put them in individually.
You can Look Back as far back as you want but I find that each time frame looks better if you keep it to multiple of the next
IE : 1 min - look back 5 (5 min) up to 15 (15 min)
5 min - look back 3 (15 min) up to 12 (1 hour)
15 min - look back 4 (1 hour) up to 16 ( 4 hours)
1 hour - look back 4 (4 hours) up to 8 (8 hours - 1 trading session)
4 hour - look back 2 (8 hours - 1 trading session) up to 6 ( 1 Day)
1 day - look back 5 ( 1 week)
Shooting stars, Hammers and Doji's are very easy to recognize
Long wicks on top - Bearish
Long wick on bottom - Bullish
Support and Resistance is easier to spot as well :-)
Hope this helps someone - defiantly helps me time entries
Comments welcome and Happy Trading
Open-source script
In true TradingView spirit, the creator of this script has made it open-source, so that traders can review and verify its functionality. Kudos to the author! While you can use it for free, remember that republishing the code is subject to our House Rules.
Disclaimer
The information and publications are not meant to be, and do not constitute, financial, investment, trading, or other types of advice or recommendations supplied or endorsed by TradingView. Read more in the Terms of Use.