PROTECTED SOURCE SCRIPT
Updated Candles
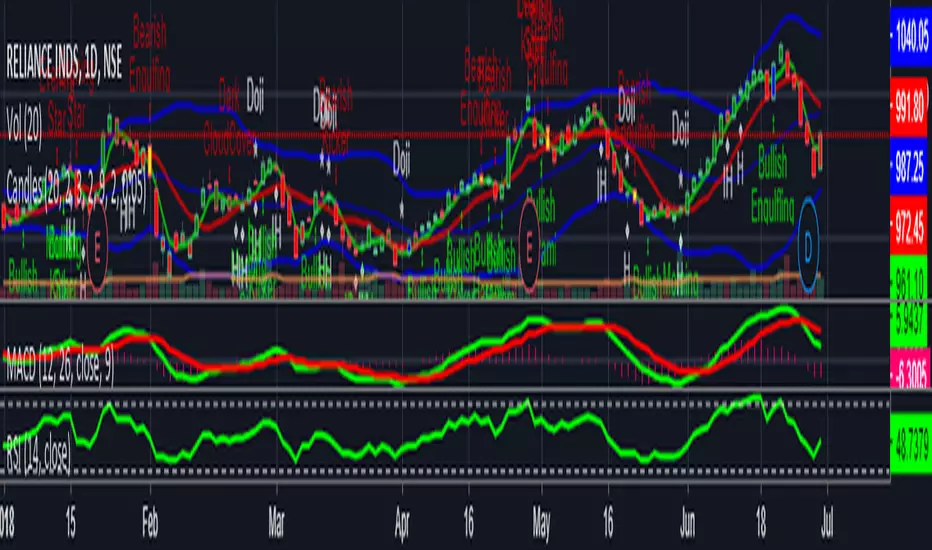
The default script has: Bolinger Bands, Moving Average and Doji , Bearish Harami, Bullish Harami, Bearish Engulfing , Bullish Engulfing , Piercing Line, Bullish Belt, Bullish Kicker, and Bearish Kicker. The Piercing Line, Bullish Belt, and the Kickers will usually show up better in the daily charts.
Please note if moving average SMA (green line) crosses above SMA (red line) is uptrend , stock price will move up gradually. If suppose moving average SMA (green line) crosses below SMA(red line) is downtrend, stock price will move down. Also please validate with MACD & RSI for reference will get more clarity.
Please note if moving average SMA (green line) crosses above SMA (red line) is uptrend , stock price will move up gradually. If suppose moving average SMA (green line) crosses below SMA(red line) is downtrend, stock price will move down. Also please validate with MACD & RSI for reference will get more clarity.
Release Notes
Ichamoku Cloud indicator addedRelease Notes
#Update with Support and ResistanceSupport--> Orange Colour
Resistance--> Aqua Colour
Release Notes
#update with support and resistance colourssupport in yellow colour
resistance in aqua colour
Protected script
This script is published as closed-source. However, you can use it freely and without any limitations – learn more here.
Disclaimer
The information and publications are not meant to be, and do not constitute, financial, investment, trading, or other types of advice or recommendations supplied or endorsed by TradingView. Read more in the Terms of Use.