OPEN-SOURCE SCRIPT
Fear–Greed Index
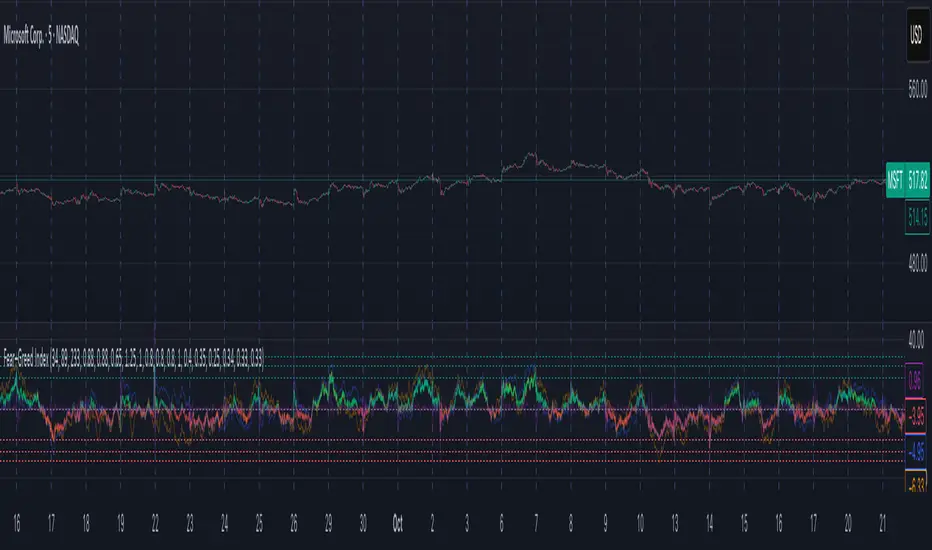
📈 Fear–Greed Index
This indicator provides a sophisticated, multi-faceted measure of market sentiment, plotting it as an oscillator that ranges from -100 (Extreme Fear) to +100 (Extreme Greed).
Unlike standard indicators like RSI or MACD, this tool is built on principles from behavioral finance and social physics to model the complex psychology of the market. It does not use any of TradingView's built-in math functions and instead calculates everything from scratch.
🤔 How It Works: The Three-Model Approach
The final index is a comprehensive blend of three different academic models, each calculated across three distinct time horizons (Short, Mid, and Long) to capture sentiment at different scales.
It combines three factors:
The indicator calculates all three models for a Short, Mid, and Long lookback period. It then aggregates these nine components (3 models x 3 timeframes) using customizable weights to produce a single, final Fear–Greed Index value.
Interpretar How to Read the Index
Key Zones:
Reference Plots: The indicator also plots the aggregated scores for each of the three models (Herding, Prospect, and SIT) as faint, secondary lines. This allows you to see which component is driving the overall sentiment.
⚙️ Settings & Customization
This indicator is highly tunable, allowing you to adjust its sensitivity and component makeup.
Time Windows:
Model Aggregation Weights:
This indicator provides a sophisticated, multi-faceted measure of market sentiment, plotting it as an oscillator that ranges from -100 (Extreme Fear) to +100 (Extreme Greed).
Unlike standard indicators like RSI or MACD, this tool is built on principles from behavioral finance and social physics to model the complex psychology of the market. It does not use any of TradingView's built-in math functions and instead calculates everything from scratch.
🤔 How It Works: The Three-Model Approach
The final index is a comprehensive blend of three different academic models, each calculated across three distinct time horizons (Short, Mid, and Long) to capture sentiment at different scales.
- Prospect Theory (CPT): This model, based on Nobel Prize-winning work, evaluates how traders perceive gains and losses. It assumes that the pain of a loss is felt more strongly than the pleasure of an equal gain, modeling the market's asymmetric emotional response.
- Herding (Brock–Durlauf): This component measures the "follow the crowd" instinct. It analyzes the synchronization of positive and negative returns to determine if traders are acting in a coordinated, "herd-like" manner, which is a classic sign of building fear or greed.
- Social Impact Theory (SIT): This model assesses how social forces influence market participants.
It combines three factors:
- Strength (S): The magnitude of recent price moves (volatility).
- Immediacy (I): How recently the most significant price action occurred.
- Number (N): The level of market participation (volume).
The indicator calculates all three models for a Short, Mid, and Long lookback period. It then aggregates these nine components (3 models x 3 timeframes) using customizable weights to produce a single, final Fear–Greed Index value.
Interpretar How to Read the Index
- Main Line: This is the final FGI score.
- Lime/Green: Indicates Greed (positive values).
- Red: Indicates Fear (negative values).
- Fading Color: The color becomes more transparent as the index approaches the '0' (Neutral) line, and more solid as it moves toward the extremes.
Key Zones:
- +100 to +30 (Extreme Greed): The market is highly euphoric and potentially overbought. This can be a contrarian signal for caution or profit-taking.
- +30 to +18 (Greed Zone): Strong bullish sentiment.
- +18 to -18 (Neutral Zone): The market is undecided, or fear and greed are in balance.
- -18 to -30 (Fear Zone): Strong bearish sentiment.
- -30 to -100 (Extreme Fear): The market is in a state of panic and may be oversold. This can be a contrarian signal for potential buying opportunities.
Reference Plots: The indicator also plots the aggregated scores for each of the three models (Herding, Prospect, and SIT) as faint, secondary lines. This allows you to see which component is driving the overall sentiment.
⚙️ Settings & Customization
This indicator is highly tunable, allowing you to adjust its sensitivity and component makeup.
Time Windows:
- Short window: Lookback period for short-term sentiment.
- Mid window: Lookback for medium-term sentiment.
- Long window: Lookback for long-term sentiment.
Model Aggregation Weights:
- Weight CPT, Weight Herding, Weight SIT: Control how much each of the three behavioral models contributes to the final score (they should sum to 1.0).
- Cross-Horizon Weights:
- Weight Short, Weight Mid, Weight Long: Control the influence of each timeframe on the final score (they should also sum to 1.0).
Open-source script
In true TradingView spirit, the creator of this script has made it open-source, so that traders can review and verify its functionality. Kudos to the author! While you can use it for free, remember that republishing the code is subject to our House Rules.
Disclaimer
The information and publications are not meant to be, and do not constitute, financial, investment, trading, or other types of advice or recommendations supplied or endorsed by TradingView. Read more in the Terms of Use.