PROTECTED SOURCE SCRIPT
Probability of Monday Rise After Friday Fall
Purpose:
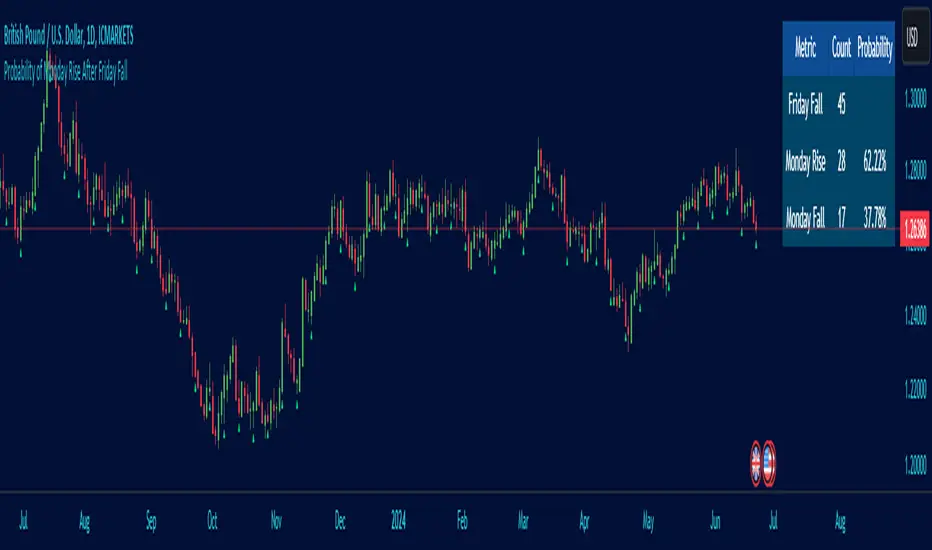
This indicator calculates the probability of a price rise on Monday following a fall on the preceding Friday. It marks Fridays on the chart and displays the count and probabilities of such occurrences over the last 500 bars (or a user-defined lookback period).
Inputs:
Lookback Period: The number of bars to look back for the analysis (default is 500).
Mark Fridays?: Option to mark Fridays on the chart.
Table Background Color: The background color of the results table.
Text Color: The color of the text in the results table.
Logic:
Initialization:
The script initializes counters for:
Fridays with a fall (bear bars).
Mondays with a rise (bull bars) following a Friday fall.
Mondays with a fall (bear bars) following a Friday fall.
Definitions:
isFriday(): Checks if a bar is a Friday.
isMonday(): Checks if a bar is a Monday.
Data Analysis:
The script iterates over the last 500 bars (or the user-defined lookback period) to:
Identify Fridays with a fall (bear bars).
Check the next bar to see if it is a Monday and if it follows a Friday fall. If so, it checks whether the Monday is a rise (bull bar) or a fall (bear bar) and increments the corresponding counter.
Calculating Probabilities:
Probability of Monday Rise after Friday Fall: The ratio of Mondays with a rise following a Friday fall to the total number of Friday falls, expressed as a percentage.
Probability of Monday Fall after Friday Fall: The ratio of Mondays with a fall following a Friday fall to the total number of Friday falls, expressed as a percentage.
Displaying Results:
The results are displayed in a table at the top right corner of the chart, showing:
The count of Fridays with a fall.
The count and probability of Mondays with a rise following a Friday fall.
The count and probability of Mondays with a fall following a Friday fall.
Marking Fridays:
Optionally, the script marks Fridays on the chart with a triangle below the bar.
Protected script
This script is published as closed-source. However, you can use it freely and without any limitations – learn more here.
Disclaimer
The information and publications are not meant to be, and do not constitute, financial, investment, trading, or other types of advice or recommendations supplied or endorsed by TradingView. Read more in the Terms of Use.