PROTECTED SOURCE SCRIPT
[N]RSIOMA
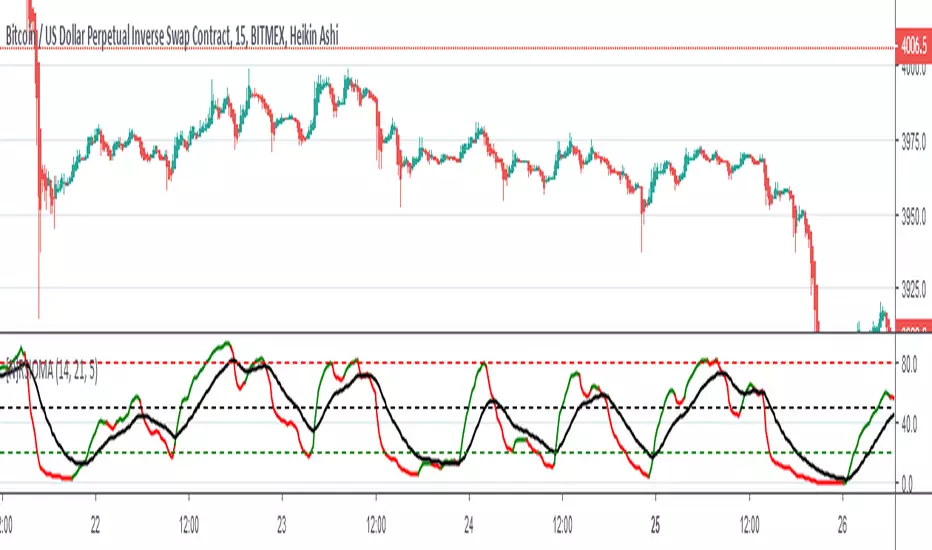
RSIOMA is the abbreviation for Relative Strength index (RSI) of moving averages (MA).
Rules:
RSI above MA and RSI above level 50 is a signal of a bullish trend. RSI below MA and RSI below level 50 is a signal of a bearish trend.
One can also buy when the RSI breaks level 20 from below and sell when RSI breaks level 80 from above
Tip 1: Look out for bounces. When RSI line bounces off from MA line it means the trend will likely continue;
Tip 2: Look out for support / resistance of RSI LINE.
Tip 3: USE as follow = higher timeframe to lower timeframe
Protected script
This script is published as closed-source. However, you can use it freely and without any limitations – learn more here.
Disclaimer
The information and publications are not meant to be, and do not constitute, financial, investment, trading, or other types of advice or recommendations supplied or endorsed by TradingView. Read more in the Terms of Use.