OPEN-SOURCE SCRIPT
Trendfinding and Range
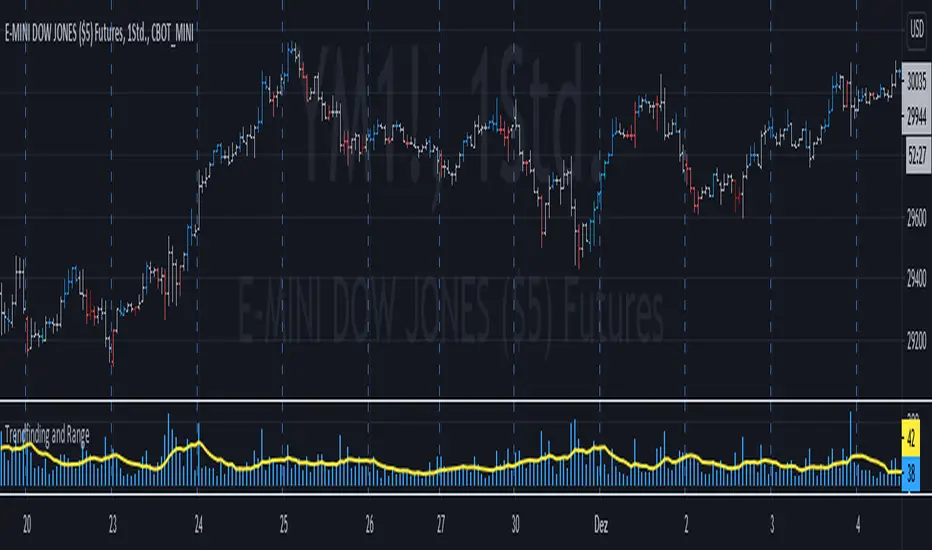
The indicator shows the trading range and the average trading range over a freely selectable period.
Der Indikator zeigt die Handelspanne und die durchschnittliche Handelspanne über eine frei wählbare Periode.
The colored price bars signal possible entry points into a beginning trend. The colors aqua and blue show possible entries in an upward trend, the colors dark red and red show possible entries in a downward trend. The breakout above the respective high / low of the colored bar is traded. The entry signal elements arise when three higher / lower segments have been formed. Three segments can be three higher lows, three lower highs, three extremes in a row or segments with price bars in between. It goes without saying that these signals must not be traded on their own, you will need further confirmation.
Die farbigen Kursstäbe signalisieren mögliche Einstiegspunkte in einen beginnenden Trend. Die Farben aqua und blue zeigen mögliche Einstiege in einem Aufwärtstrend, die Farben dunkelrot und rot zeigen mögliche Einstiege in einem Abwärtstrend. Der Ausbruch über das jeweilige Hoch/ Tief des colorierten Kursstabes wird gehandelt. Die Einstiegssignalele entstehen, wenn drei höhere/ tiefere Segmente gebildet wurden. Drei Segmente könne drei höhere Tiefs, drei tiefere Hochs, drei Extreme in Folge oder Segmente mit dazwichen liegenden Kursstäben sein. Es versteht sich von selbst, dass diese Signale nicht für sich allein gehandelt werden dürfen, Sie benötigen weitere Bestätigungen.
Open-source script
In true TradingView spirit, the creator of this script has made it open-source, so that traders can review and verify its functionality. Kudos to the author! While you can use it for free, remember that republishing the code is subject to our House Rules.
Disclaimer
The information and publications are not meant to be, and do not constitute, financial, investment, trading, or other types of advice or recommendations supplied or endorsed by TradingView. Read more in the Terms of Use.