Summit Line
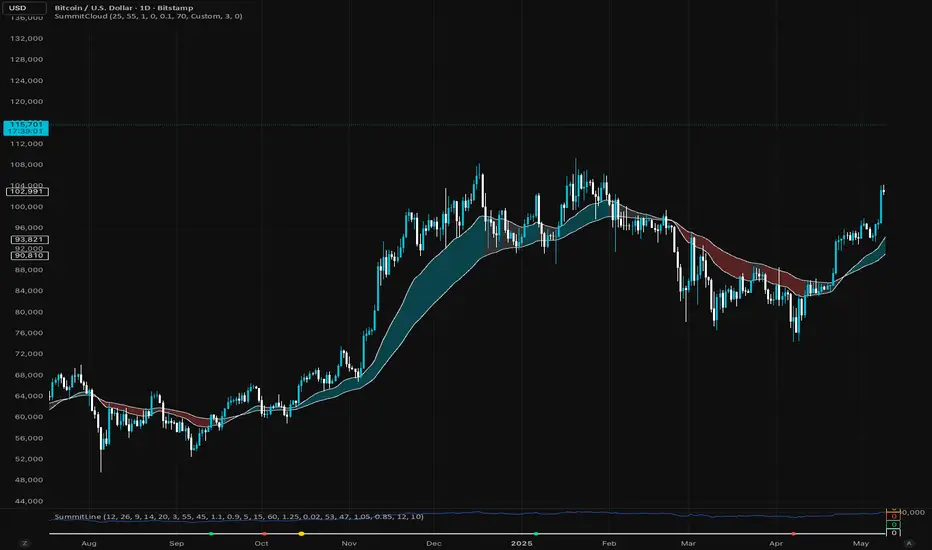
It blends MACD, RSI, moving averages and Volume Strength, giving traders a real time gauge of momentum shifts and exhaustion points.
🟢 Green Dot: Bullish confluence
🔴 Red Dot: Bearish confluence
🟡 Gold Dot: “A+” setup, rare alignment of all core metrics, typically at high-probability reversal or breakout zones.
Unlike noisy indicators, Summit Line filters weak signals using RSI slope, volume surges, and EMA trend structure, keeping the chart clean and accurate.
Every dot is pinned along a flat zero baseline for visual simplicity, ideal for combining with the Summit cloud or other price overlays.
Invite-only script
Only users approved by the author can access this script. You'll need to request and get permission to use it. This is typically granted after payment. For more details, follow the author's instructions below or contact jedhucker directly.
TradingView does NOT recommend paying for or using a script unless you fully trust its author and understand how it works. You may also find free, open-source alternatives in our community scripts.
Author's instructions
Disclaimer
Invite-only script
Only users approved by the author can access this script. You'll need to request and get permission to use it. This is typically granted after payment. For more details, follow the author's instructions below or contact jedhucker directly.
TradingView does NOT recommend paying for or using a script unless you fully trust its author and understand how it works. You may also find free, open-source alternatives in our community scripts.