OPEN-SOURCE SCRIPT
New Highs & New Lows – Marker
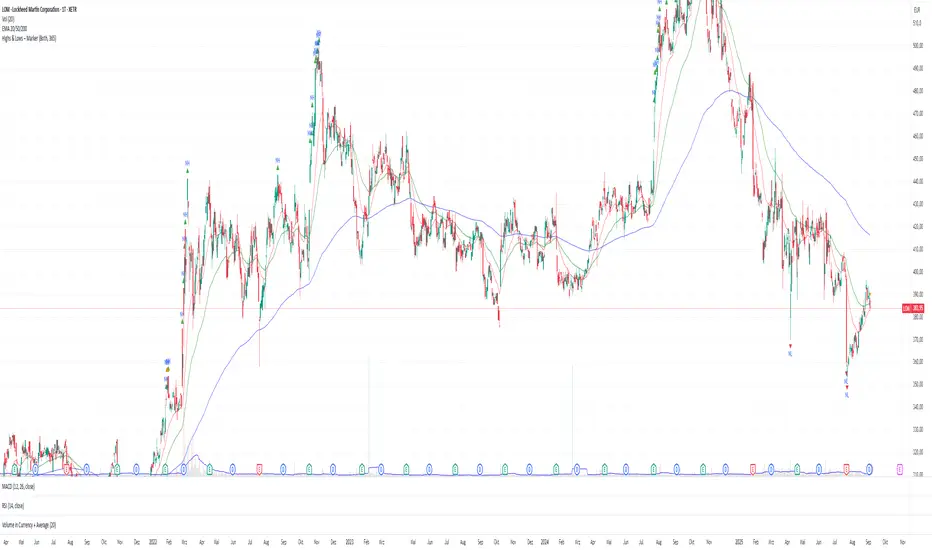
New Highs & New Lows – Marker (with Equal Highs/Lows)
Description
This indicator automatically highlights new highs and lows on your chart. It works in two modes:
All-Time Mode (Lookback = 0): Marks all-time highs and lows since the start of the chart.
Lookback Mode (Lookback > 0): Marks new highs or lows relative to the last N bars.
Both new extremes and equal highs/lows (ties) can be visualized with different colors and shapes. Alerts are included so you can be notified as soon as new highs or lows appear.
Use this tool to quickly spot breakouts, double tops/bottoms, or potential support/resistance levels.
Features
✅ Detect new highs and new lows
✅ Highlight equal highs and lows (ties)
✅ All-Time or rolling lookback mode
✅ Option to show only highs, only lows, or both
✅ Customizable colors and markers
✅ Built-in alerts for all conditions
Inputs & Settings
Mode: Choose between
Lookback:
Colors:
Alerts
How to Use
Add the indicator to your chart.
Choose Lookback = 0 to track all-time highs/lows, or set a number (e.g., 20) for a rolling window.
Select Mode → Highs only, Lows only, or Both.
Customize colors and alerts to fit your strategy.
Watch for markers above/below bars:
Triangles Up (above candles) → Highs
Triangles Down (below candles) → Lows
Description
This indicator automatically highlights new highs and lows on your chart. It works in two modes:
All-Time Mode (Lookback = 0): Marks all-time highs and lows since the start of the chart.
Lookback Mode (Lookback > 0): Marks new highs or lows relative to the last N bars.
Both new extremes and equal highs/lows (ties) can be visualized with different colors and shapes. Alerts are included so you can be notified as soon as new highs or lows appear.
Use this tool to quickly spot breakouts, double tops/bottoms, or potential support/resistance levels.
Features
✅ Detect new highs and new lows
✅ Highlight equal highs and lows (ties)
✅ All-Time or rolling lookback mode
✅ Option to show only highs, only lows, or both
✅ Customizable colors and markers
✅ Built-in alerts for all conditions
Inputs & Settings
Mode: Choose between
- Both → Show both highs and lows
- Only Highs → Show only highs
- Only Lows → Show only lows
Lookback:
- 0 → All-Time Highs/Lows (since the beginning of the chart)
- >0 → Rolling highs/lows based on the last N bars
- Show New Highs/Lows: Toggle visibility of fresh highs/lows
- Show Equal Highs/Lows: Toggle visibility of ties (same high/low as reference)
Colors:
- Green → New Highs
- Orange → Equal Highs
- Red → New Lows
- Orange → Equal Lows
Alerts
- The indicator includes 4 alert conditions:
- New High – when a bar creates a higher high
- Equal High – when a bar touches the same high
- New Low – when a bar creates a lower low
- Equal Low – when a bar touches the same low
- To enable, simply add an alert in TradingView and select the desired condition.
How to Use
Add the indicator to your chart.
Choose Lookback = 0 to track all-time highs/lows, or set a number (e.g., 20) for a rolling window.
Select Mode → Highs only, Lows only, or Both.
Customize colors and alerts to fit your strategy.
Watch for markers above/below bars:
Triangles Up (above candles) → Highs
Triangles Down (below candles) → Lows
Open-source script
In true TradingView spirit, the creator of this script has made it open-source, so that traders can review and verify its functionality. Kudos to the author! While you can use it for free, remember that republishing the code is subject to our House Rules.
Disclaimer
The information and publications are not meant to be, and do not constitute, financial, investment, trading, or other types of advice or recommendations supplied or endorsed by TradingView. Read more in the Terms of Use.