OPEN-SOURCE SCRIPT
Double RSI
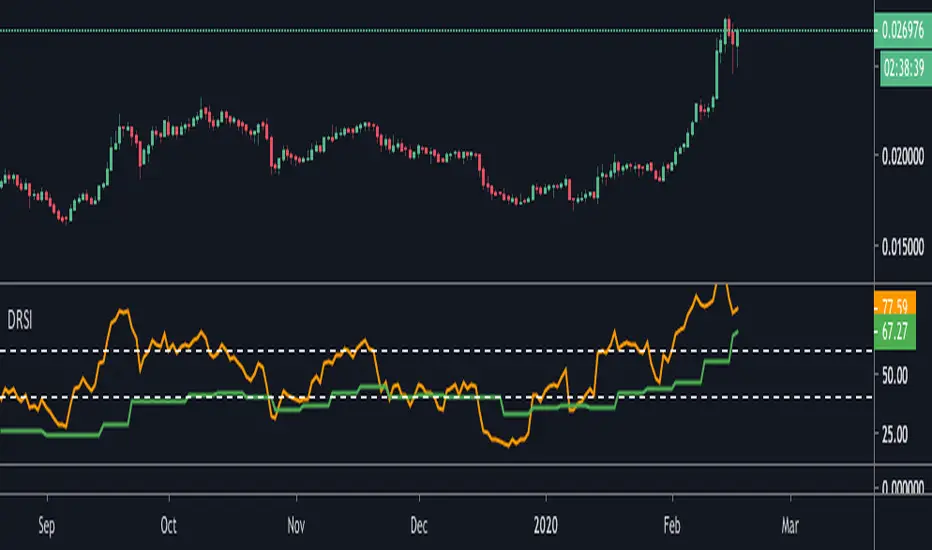
This is double RSI script which plots one time frame higher RSI along with the current time frame i.e
For Weekly chart it display Weekly and Monthly RSI
For Daily chart it display Daily and Weekly RSI
For Intraday chart it display Intraday and Daily RSI.
Usage:
If Daily RSI is above 60 and weekly above 40 and moving up then stock is in a good uptrend look for buying when Daily takes support at 60. Usually First test of Daily produces a good entry for subsequent entries probability decreases.
For Downtrend look for Daily RSI below 40 and weekly below 60.
Open-source script
In true TradingView spirit, the creator of this script has made it open-source, so that traders can review and verify its functionality. Kudos to the author! While you can use it for free, remember that republishing the code is subject to our House Rules.
Disclaimer
The information and publications are not meant to be, and do not constitute, financial, investment, trading, or other types of advice or recommendations supplied or endorsed by TradingView. Read more in the Terms of Use.