OPEN-SOURCE SCRIPT
Updated Ehlers Sinewave Indicator V2 [CC]
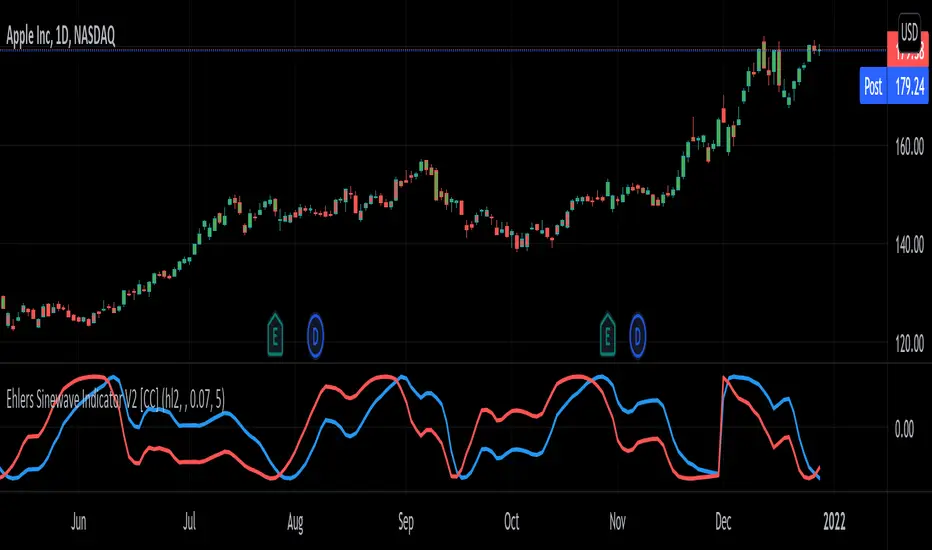
The Sinewave Indicator was created by John Ehlers (Cybernetic Analysis For Stocks And Futures pgs 154-155) and this is an updated version of his original Sinewave Indicator which in my opinion seems to be more reactive to changes. Buy when the blue line crosses over the red line and sell when the blue line crosses under the red line. Also keep in mind that this indicator is based on cycles so it won't act the same as a typical indicator.
Let me know if there are other scripts you would like to see me publish or if you want something custom done!
Let me know if there are other scripts you would like to see me publish or if you want something custom done!
Release Notes
Updated to v5Open-source script
In true TradingView spirit, the creator of this script has made it open-source, so that traders can review and verify its functionality. Kudos to the author! While you can use it for free, remember that republishing the code is subject to our House Rules.
I created the largest stock indicator library:
github.com/ooples/
Custom Indicator Requests:
forms.gle/ouMffZR3dQ8bSJQG7
Tips are appreciated:
paypal.me/cheatcountry
patreon.com/cheatcountry
github.com/ooples/
Custom Indicator Requests:
forms.gle/ouMffZR3dQ8bSJQG7
Tips are appreciated:
paypal.me/cheatcountry
patreon.com/cheatcountry
Disclaimer
The information and publications are not meant to be, and do not constitute, financial, investment, trading, or other types of advice or recommendations supplied or endorsed by TradingView. Read more in the Terms of Use.
Open-source script
In true TradingView spirit, the creator of this script has made it open-source, so that traders can review and verify its functionality. Kudos to the author! While you can use it for free, remember that republishing the code is subject to our House Rules.
I created the largest stock indicator library:
github.com/ooples/
Custom Indicator Requests:
forms.gle/ouMffZR3dQ8bSJQG7
Tips are appreciated:
paypal.me/cheatcountry
patreon.com/cheatcountry
github.com/ooples/
Custom Indicator Requests:
forms.gle/ouMffZR3dQ8bSJQG7
Tips are appreciated:
paypal.me/cheatcountry
patreon.com/cheatcountry
Disclaimer
The information and publications are not meant to be, and do not constitute, financial, investment, trading, or other types of advice or recommendations supplied or endorsed by TradingView. Read more in the Terms of Use.