OPEN-SOURCE SCRIPT
Uptrick: Price Exaggerator
## Uptrick: Price Exaggerator
**Purpose and Overview**:
The "Uptrick: Price Exaggerator" is an innovative Pine Script™ indicator that provides traders with a unique way to visualize potential price extremes. Unlike traditional indicators that focus on historical price data or statistical patterns, this script applies dynamic multipliers to the asset’s closing price to project exaggerated price levels. This approach offers fresh insights into potential market extremes and can be particularly useful for identifying possible overbought or oversold conditions.
**Functionality**:
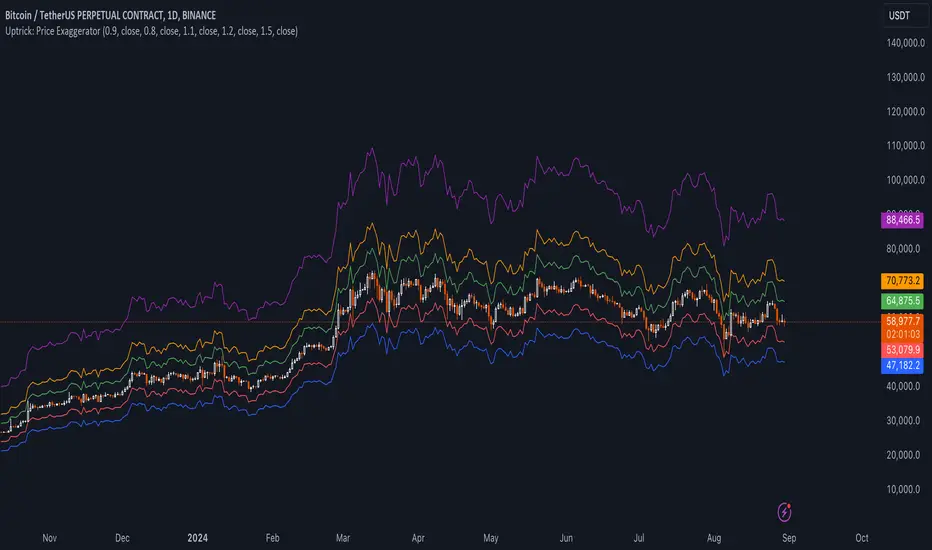
- **Dynamic Price Exaggeration**: This script applies a range of multipliers to the closing price to generate several projected price levels. These levels are plotted as lines on the chart, helping traders visualize potential future price extremes beyond typical market ranges.
- **Highly Customizable**: Users can adjust multipliers, select different source prices (like open, high, low), and choose colors to match their trading strategies and preferences.
- **Real-Time Updates**: The plotted levels update in real-time, reflecting the latest market conditions and providing an ongoing perspective on potential price extremes.
**Detailed Inputs and Configuration**:
1. **Multiplier Settings**:
- **Purpose**: Adjusts the degree of price exaggeration to visualize potential extreme price levels.
- **Inputs**:
- **Multiplier 1**: Default 0.9 (90% of the source price)
- **Multiplier 2**: Default 0.8 (80% of the source price)
- **Multiplier 3**: Default 1.1 (110% of the source price)
- **Multiplier 4**: Default 1.2 (120% of the source price)
- **Multiplier 5**: Default 1.5 (150% of the source price)
- **Impact**: Higher multipliers show more distant potential levels, indicating possible resistance or support at extreme levels. Lower multipliers highlight nearer levels, suggesting smaller potential movements.
2. **Source Price Selection**:
- **Purpose**: Determines the base data for calculating exaggerated price levels.
- **Inputs**:
- **Source 1**: Default is closing price (can be customized)
- **Source 2**: Default is closing price
- **Source 3**: Default is closing price
- **Source 4**: Default is closing price
- **Source 5**: Default is closing price
- **Customization**: Users can select various sources (e.g., open, high, low) for each multiplier, tailoring the tool to their analytical needs.
3. **Color Customization**:
- **Purpose**: Enhances visual clarity by distinguishing between different exaggerated levels.
- **Inputs**:
- **Color 1**: Default red
- **Color 2**: Default blue
- **Color 3**: Default green
- **Color 4**: Default orange
- **Color 5**: Default purple
- **Customization**: Colors can be adjusted to fit user preferences and chart color schemes.
4. **Plotting the Lines**:
- **Purpose**: Provides a visual representation of potential future price extremes on the chart.
- **Implementation**: Lines are plotted based on the selected multipliers and source prices, offering a clear view of potential price scenarios.
**Using the Script for Market Analysis**:
1. **Identifying Overbought Conditions**:
- **Method**: Observe exaggerated price levels above the current market price. Approaching or exceeding higher multiplier levels may indicate overbought conditions.
- **Analysis**: These levels can act as potential resistance zones where price reversals or consolidations might occur.
2. **Spotting Oversold Conditions**:
- **Method**: Observe exaggerated price levels below the current market price. If the price approaches or falls below lower multiplier levels, it may suggest oversold conditions.
- **Analysis**: These levels might serve as support zones where price bounces or stabilization could happen.
3. **Detecting Smaller Movements**:
- **Detailed Examination**: Lower multiplier levels can highlight minor support and resistance levels, useful for traders focusing on smaller price fluctuations.
- **Fine-Tuning**: Adjust multipliers to zoom in on specific price ranges and better detect small market movements.
**How to Use the Script**:
1. **Add the Script to Your Chart**:
- Scroll to the bottom of this description and right where there is the source code, click 'Add to Favourites' - Now you can go to a chart, go to your 'favorites', and you will find it there.
2. **Configure Inputs**:
- Click the gear icon next to the script in the indicators panel to open settings.
- Adjust multipliers, source prices, and colors according to your analysis needs.
3. **Interpret the Levels**:
- Analyze the plotted levels to assess potential overbought or oversold conditions and identify possible price extremes.
- Combine insights with other indicators and patterns for more informed trading decisions.
**Conceptual Framework**:
The "Uptrick: Price Exaggerator" offers a novel approach to market analysis by exaggerating price levels through dynamic multipliers. This unique method extends beyond conventional indicators, providing traders with a different perspective on potential price movements and market extremes. By customizing inputs and visualizing potential price scenarios, this script enhances market analysis and supports diverse trading strategies.
**Originality and Uniqueness**:
This script stands out by applying dynamic multipliers to the source price, offering a fresh way to anticipate potential market extremes. Unlike standard indicators, which often rely on historical data or statistical methods, the "Uptrick: Price Exaggerator" provides a distinctive view of future price levels. Its customizable features and real-time updates offer traders a flexible tool that can adapt to various market conditions and personal trading styles.
Open-source script
In true TradingView spirit, the creator of this script has made it open-source, so that traders can review and verify its functionality. Kudos to the author! While you can use it for free, remember that republishing the code is subject to our House Rules.
💎 Free Discord: discord.gg/Def47ueyuD
💎 Website: uptrick.io
Nothing is financial advice. Always do your own research.
💎 Website: uptrick.io
Nothing is financial advice. Always do your own research.
Disclaimer
The information and publications are not meant to be, and do not constitute, financial, investment, trading, or other types of advice or recommendations supplied or endorsed by TradingView. Read more in the Terms of Use.