OPEN-SOURCE SCRIPT
Supp_Ress_V1
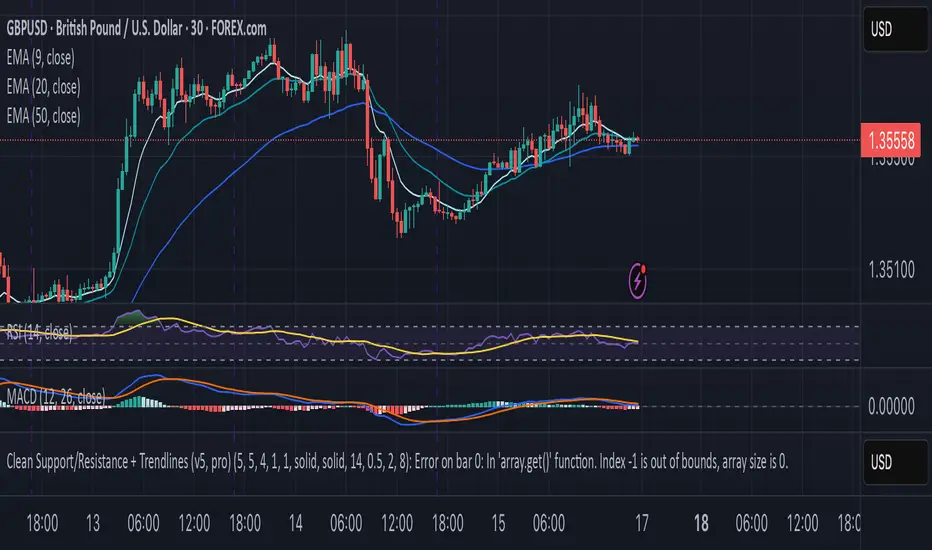
This indicator automatically plots support and resistance levels using confirmed pivot highs and lows, then manages them smartly by merging nearby levels, extending them, and removing them once price breaks through.
It also draws trendlines by connecting valid higher-lows (uptrend) or lower-highs (downtrend), ensuring they slope correctly and have enough spacing between pivots.
In short: it gives you a clean, trader-like map of the most relevant S/R zones and trendlines, updating dynamically as price action unfolds.
Open-source script
In true TradingView spirit, the creator of this script has made it open-source, so that traders can review and verify its functionality. Kudos to the author! While you can use it for free, remember that republishing the code is subject to our House Rules.
Disclaimer
The information and publications are not meant to be, and do not constitute, financial, investment, trading, or other types of advice or recommendations supplied or endorsed by TradingView. Read more in the Terms of Use.