OPEN-SOURCE SCRIPT
Updated Ehlers Spectrum Derived Filter Bank [CC]
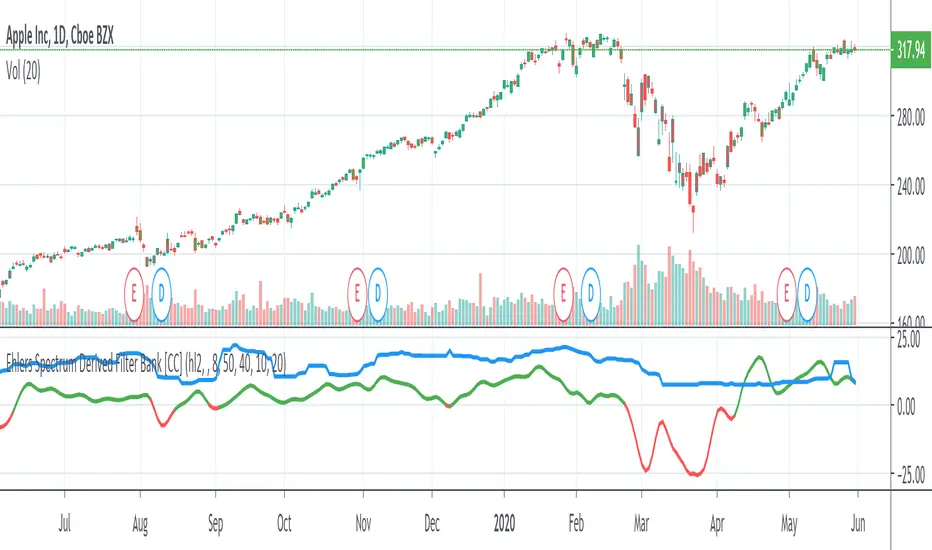
The Spectrum Derived Filter Bank was created by John Ehlers (Stocks & Commodities V. 26:3 (16-22)) and this is technically two indicators in one. This will let you know the current cycle period which is in blue and the other indicator will let you know if you should buy the stock or not. Buy when it is green and sell when it is red.
Let me know if you would like me to publish other scripts or if you want something custom done!
Note: I'm republishing this because the original script couldn't be found in searches so this will fix that.
Let me know if you would like me to publish other scripts or if you want something custom done!
Note: I'm republishing this because the original script couldn't be found in searches so this will fix that.
Release Notes
fixed issue with default resolutionOpen-source script
In true TradingView spirit, the creator of this script has made it open-source, so that traders can review and verify its functionality. Kudos to the author! While you can use it for free, remember that republishing the code is subject to our House Rules.
I created the largest stock indicator library:
github.com/ooples/
Custom Indicator Requests:
forms.gle/ouMffZR3dQ8bSJQG7
Tips are appreciated:
paypal.me/cheatcountry
patreon.com/cheatcountry
github.com/ooples/
Custom Indicator Requests:
forms.gle/ouMffZR3dQ8bSJQG7
Tips are appreciated:
paypal.me/cheatcountry
patreon.com/cheatcountry
Disclaimer
The information and publications are not meant to be, and do not constitute, financial, investment, trading, or other types of advice or recommendations supplied or endorsed by TradingView. Read more in the Terms of Use.
Open-source script
In true TradingView spirit, the creator of this script has made it open-source, so that traders can review and verify its functionality. Kudos to the author! While you can use it for free, remember that republishing the code is subject to our House Rules.
I created the largest stock indicator library:
github.com/ooples/
Custom Indicator Requests:
forms.gle/ouMffZR3dQ8bSJQG7
Tips are appreciated:
paypal.me/cheatcountry
patreon.com/cheatcountry
github.com/ooples/
Custom Indicator Requests:
forms.gle/ouMffZR3dQ8bSJQG7
Tips are appreciated:
paypal.me/cheatcountry
patreon.com/cheatcountry
Disclaimer
The information and publications are not meant to be, and do not constitute, financial, investment, trading, or other types of advice or recommendations supplied or endorsed by TradingView. Read more in the Terms of Use.