OPEN-SOURCE SCRIPT
CCI Super Bands
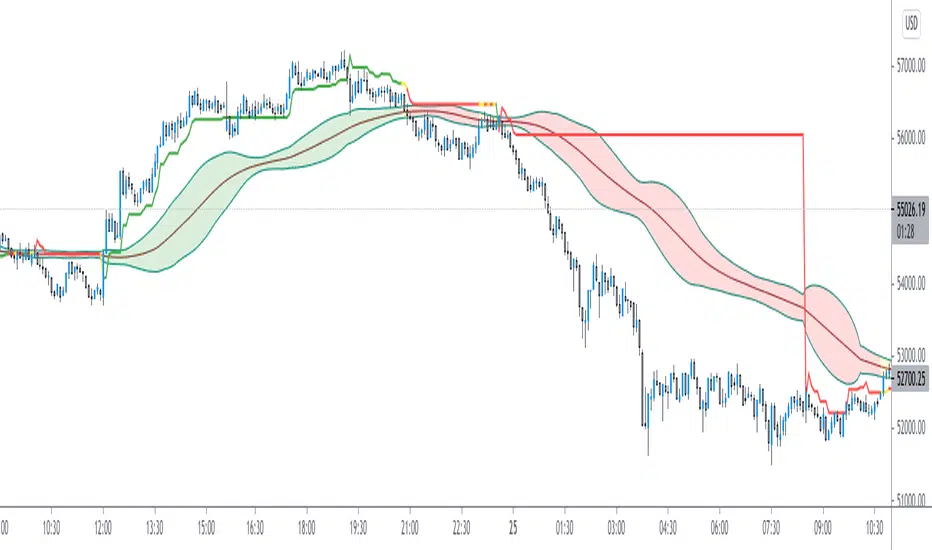
CCi Super Bands,
Is an Indicator to plot Commodity Channel Index Projections over the Price Chart
It's offers interesting price Analysis
There are two major parts to the indicator!
1. The Optimal CCI Line
2. A CCI Standard Deviation Bands
Color Codes Meaning:
Red : Strength in Bearish Intent
Green : Strength in Bullish Intent
Yellow : Consolidation estimations
Try to play with this indicator
and Enjoy
Open-source script
In true TradingView spirit, the creator of this script has made it open-source, so that traders can review and verify its functionality. Kudos to the author! While you can use it for free, remember that republishing the code is subject to our House Rules.
Get Ocs Ai Trader, Your personal Ai Trade Assistant here
→ ocstrader.com
About me
AlgoTrading Certification, ( University of Oxford, Säid Business School )
PGP Research Analysis, ( NISM, SEBI )
Electronics Engineer
→ ocstrader.com
About me
AlgoTrading Certification, ( University of Oxford, Säid Business School )
PGP Research Analysis, ( NISM, SEBI )
Electronics Engineer
Disclaimer
The information and publications are not meant to be, and do not constitute, financial, investment, trading, or other types of advice or recommendations supplied or endorsed by TradingView. Read more in the Terms of Use.