OPEN-SOURCE SCRIPT
Updated Diagonal Support and Resistance Trend Lines
A simple indicator to plot trend lines.
1. Adjust the "Pivot Lookback" (default: 20) to control pivot sensitivity. Larger values detect more significant pivots.
2. Adjust the "Max Trend Lines" (default: 4) to control how many support/resistance lines are drawn.
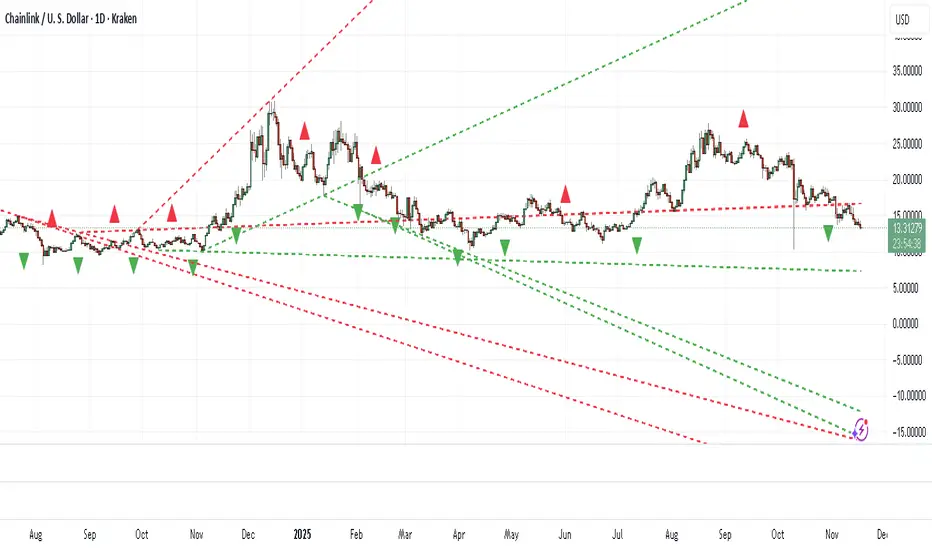
The indicator will plot:
1. Red dashed lines for resistance (based on pivot highs).
2. Green dashed lines for support (based on pivot lows).
3. Small red triangles above bars for pivot highs and green triangles below bars for pivot lows.
1. Adjust the "Pivot Lookback" (default: 20) to control pivot sensitivity. Larger values detect more significant pivots.
2. Adjust the "Max Trend Lines" (default: 4) to control how many support/resistance lines are drawn.
The indicator will plot:
1. Red dashed lines for resistance (based on pivot highs).
2. Green dashed lines for support (based on pivot lows).
3. Small red triangles above bars for pivot highs and green triangles below bars for pivot lows.
Release Notes
Updated to v6 and added option to display dotted, dash, or solid lines.Release Notes
EditRelease Notes
You can now set the thickness of trend line.Open-source script
In true TradingView spirit, the creator of this script has made it open-source, so that traders can review and verify its functionality. Kudos to the author! While you can use it for free, remember that republishing the code is subject to our House Rules.
Disclaimer
The information and publications are not meant to be, and do not constitute, financial, investment, trading, or other types of advice or recommendations supplied or endorsed by TradingView. Read more in the Terms of Use.
Open-source script
In true TradingView spirit, the creator of this script has made it open-source, so that traders can review and verify its functionality. Kudos to the author! While you can use it for free, remember that republishing the code is subject to our House Rules.
Disclaimer
The information and publications are not meant to be, and do not constitute, financial, investment, trading, or other types of advice or recommendations supplied or endorsed by TradingView. Read more in the Terms of Use.