OPEN-SOURCE SCRIPT
Position Sizer by Volatility
Description:
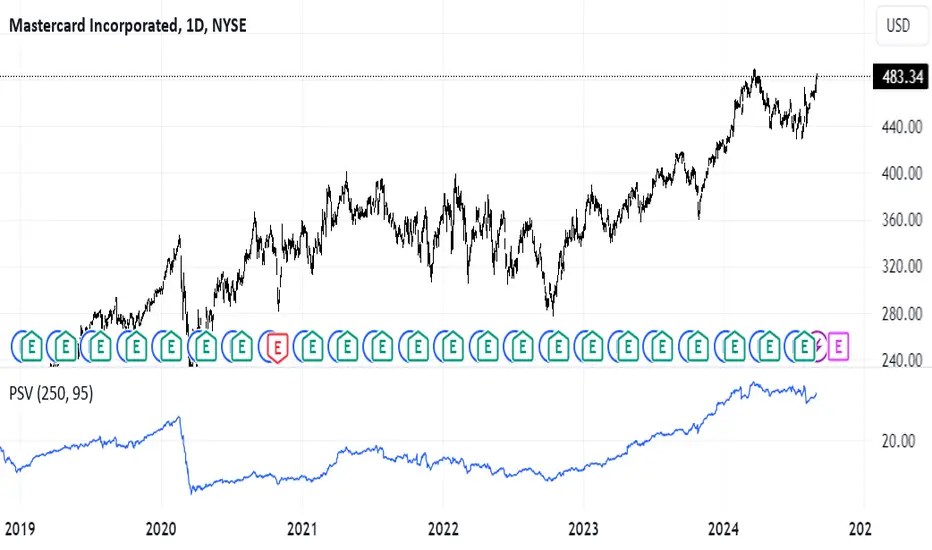
The **Position Sizer by Volatility (PSV)** is an indicator that helps traders determine what percentage of their deposit a position will occupy, taking into account the current market volatility. PSV calculates the range of price movements over recent periods and shows how large this movement is compared to historical data. The lower the value, the lower the volatility, and the smaller the stop-loss required relative to the current price.
Explanation of PSV Parameters:
- `len` (Period Length):** This parameter sets the number of candles (bars) on the chart that will be used to calculate volatility. For example, if `len` is set to 250, the indicator will analyze price movements over the last 250 bars. The larger the value, the longer the period used for volatility assessment.
- `percent` (Percentile):** This parameter determines how strong price fluctuations you want to account for. For instance, if you set `percent` to 95, the indicator will focus on the 5% of instances where the price range was the largest over the specified period. This helps evaluate volatility during periods of sharp price movements, which may require a larger stop-loss. A higher percentile accounts for rarer but stronger movements, and vice versa.
Open-source script
In true TradingView spirit, the creator of this script has made it open-source, so that traders can review and verify its functionality. Kudos to the author! While you can use it for free, remember that republishing the code is subject to our House Rules.
Disclaimer
The information and publications are not meant to be, and do not constitute, financial, investment, trading, or other types of advice or recommendations supplied or endorsed by TradingView. Read more in the Terms of Use.