PROTECTED SOURCE SCRIPT
Updated SMA Oscillation Strength Index
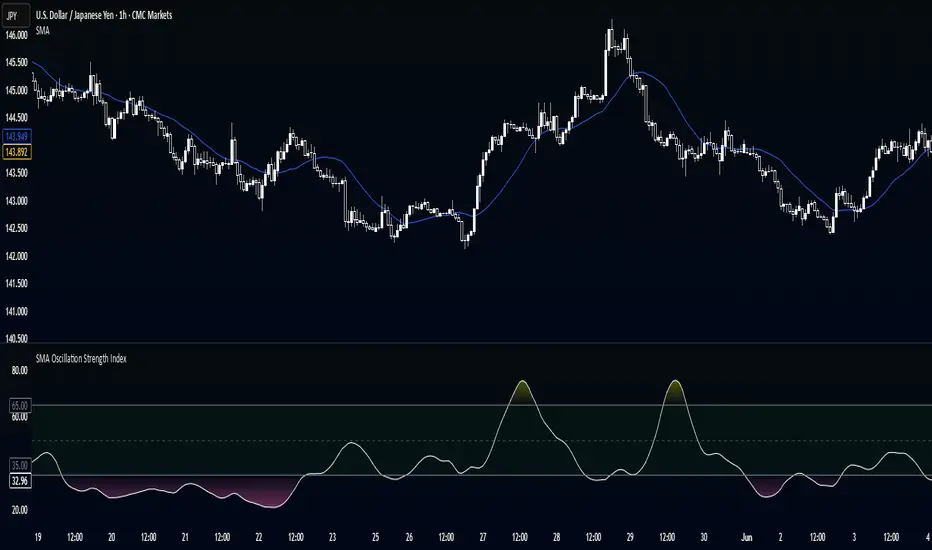
This indicator quantifies how strongly price oscillates around a simple moving average (SMA), normalized to a 0–100 scale for easier interpretation.
It calculates the standard deviation of the distance between price and its SMA over a lookback period, then normalizes that value by dividing it by the current ATR to account for volatility. This produces a raw "oscillation strength" signal.
The signal is then smoothed using an EMA and rescaled from its expected range (0–3) to a normalized 0–100 scale. The final output increases when price oscillates clearly above and below the SMA (e.g., in ranging conditions), and stays low when price hugs the SMA tightly (e.g., in low-volatility or noisy conditions).
Customizable upper and lower thresholds allow the user to mark different strength regimes, such as "ranging" vs "flat".
Release Notes
Updated ChartProtected script
This script is published as closed-source. However, you can use it freely and without any limitations – learn more here.
Disclaimer
The information and publications are not meant to be, and do not constitute, financial, investment, trading, or other types of advice or recommendations supplied or endorsed by TradingView. Read more in the Terms of Use.
Protected script
This script is published as closed-source. However, you can use it freely and without any limitations – learn more here.
Disclaimer
The information and publications are not meant to be, and do not constitute, financial, investment, trading, or other types of advice or recommendations supplied or endorsed by TradingView. Read more in the Terms of Use.