Quality-Controlled Trend StrategyOverview
This strategy demonstrates a clean, execution-aware trend framework with fully isolated risk management.
Entry conditions and risk logic are intentionally separated so risk parameters can be adjusted without altering signal behavior.
All calculations are evaluated on confirmed bars to ensure backtest behavior reflects real-time execution.
Design intent
Many scripts mix entries and exits in ways that make results fragile or misleading.
This strategy focuses on structural clarity by enforcing:
confirmed-bar logic only
fixed and transparent risk handling
consistent indicator calculations
one position at a time
It is intended as a baseline framework rather than an optimized system.
Trading logic (high level)
Trend context
EMA 50 vs EMA 200 defines directional bias
Entry
Price alignment with EMA 50
RSI used as a momentum confirmation, not as an overbought/oversold signal
Risk management
Stop-loss based on ATR
Fixed risk–reward structure
Risk logic is isolated from entry logic
Editing risk without affecting signals
All stop-loss and take-profit calculations are handled in a dedicated block.
Users can adjust:
ATR length
stop-loss multiplier
risk–reward ratio
without modifying entry conditions.
This allows controlled experimentation while preserving signal integrity.
Usage notes
Results vary by market, timeframe, and volatility conditions.
This script is provided for testing and educational purposes and should be validated across multiple symbols and forward-tested before use in live environments.
50

Quality-Controlled Trend Strategy v2 (Expectancy Focused)This script focuses on quality control rather than curve-fitting.
No repainting, no intrabar tricks, no fake equity curves.
It uses confirmed-bar entries, ATR-based risk, and clean trend logic so backtests reflect what could actually be traded live.
If you publish scripts, this is the minimum structure worth sharing.
Why this script exists
TradingView’s public scripts are flooded with:
repainting indicators
no stop-loss logic
curve-fit entries that collapse live
strategies that look good only in hindsight
This script is intentionally boring but honest.
No repainting.
No intrabar tricks.
No fake equity curves
The goal is quality control, not hype.
What this strategy enforces
✔ Confirmed bars only
✔ Single source of truth for indicators
✔ Fixed risk structure
✔ No signal repainting
✔ Clean exits with unique IDs
✔ Works on any liquid market
Trading Logic (simple & auditable)
Trend filter
EMA 50 vs EMA 200
Entry
Pullback to EMA 50
RSI confirms momentum (not oversold/overbought)
Risk
ATR-based stop
Fixed R:R
One position at a time
This is the minimum bar for a strategy to be considered publish-worthy.
Why this helps TradingView quality
Most low-value scripts fail because they:
hide repainting logic
skip exits entirely
use inconsistent calculations
rely on hindsight candles
This strategy forces discipline:
every signal is confirmed
every trade has defined risk
behavior is repeatable across symbols & timeframes
If more scripts followed this baseline, TradingView’s public library would be far more usable.

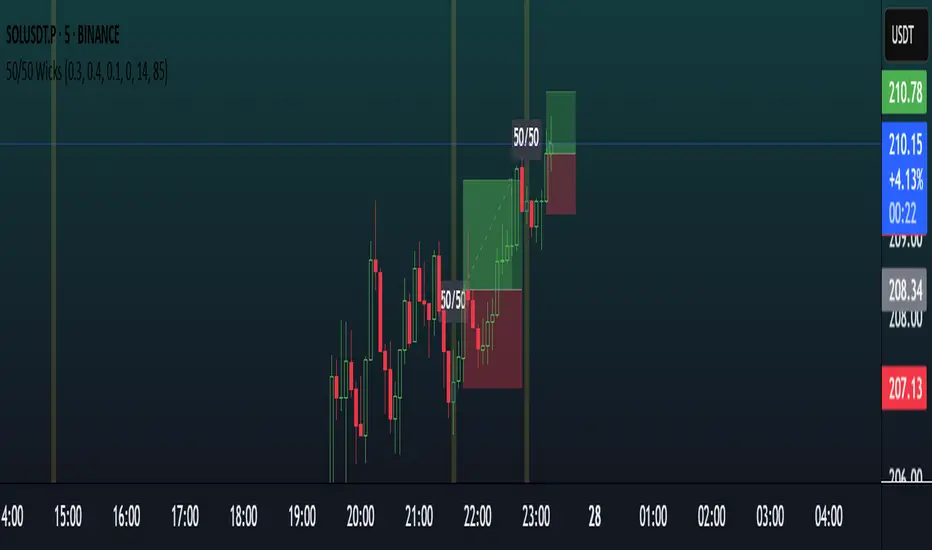
Balanced Big Wicks (50/50) HighlighterDetects candles with unusually long, balanced upper and lower wicks—a potential sign of market indecision followed by strong breakout action.
What It Does
Identifies candles where both upper and lower wicks each account for at least a configurable percentage (e.g., 30–40%) of the total range, and where the body remains small—creating the classic “balanced wick” (50/50) appearance.
Marks these candles visually with color (bullish/bearish), optional background shading, and a tiny “50/50” label above the candle.
Why It’s Useful
Balanced wicks often precede decisive moves once price breaks either wick. This script highlights such opportunities systematically.
Helpful for traders looking for clean entry signals: long on close above the upper wick, short on close below the lower wick—with straightforward risk management (SL at opposite wick, TP 1:1).
Key Inputs (default values shown in parentheses)
Min wick % (each side): 30%
Max body %: 20%
Equality tolerance: 10%
Min range filter (ATR multiples): 0 (disable)
ATR length: 14
Color candles: On
Background highlight: Off by default
Plot label on candle: On
Adjust these to fit your preferred timeframe or instrument (e.g., raise wick thresholds or ATR filter for noisy 15‑minute altcoin charts; relax slightly for smoother 1‑hour BTC analysis).
Alerts
Three alert options included:
“50/50 Wick (Any)” — triggers on any balanced-wick candle.
“50/50 Wick (Bullish)” — only when the candle closes bullish (upper close).
“50/50 Wick (Bearish)” — only when the candle closes bearish (lower close).
How to Use It
Add the indicator to your chart.
Adjust input settings to suit the timeframe or trading style.
Watch for highlighted candles.
Optional alert: create alerts using one of the provided alert conditions (e.g., “50/50 Wick (Any)”) with “Once per bar close” to get notified when signal bars appear.
Use your own trade logic (e.g., breakout entries as described above).
Disclaimer & Originality
Original Concept: I built this script from scratch to highlight a specific candle structure often used by traders in breakout setups—long balanced wicks with small bodies.
No external code references; it’s entirely open-source and self-explanatory.
Note: This indicator highlights potential setups—not financial advice. Always backtest any strategy, and use sound risk management. Past patterns do not guarantee future success.
Optimized Settings for 5m–15m Scalping
Min wick % (each side): 0.30
→ Forces both wicks to be almost half the candle each. Very strict.
Max body % of range: 0.40
→ Candle body must be ≤10% of full range = almost a doji.
Equality tolerance: 0.1
→ Wicks must be within 5% of each other relative to full candle size.
Min range filter (ATR multiples): 0
→ Candle must be at least 1.2× bigger than recent average (ATR14). Filters out weak fake dojis.
ATR Length: 14 (standard, stable)
Color candles / Plot labels: On (so you clearly see them)
Background highlight: Optional
Vantage-XVANTAGE-X – The Market. Decoded.
Your vantage point between bull & bear — clarity, precision, and high-probability trading signals.
VANTAGE-X is a high-probability trading system designed to cut through the noise and deliver clarity at a glance.
🔹 What It Does
• EMA 20 (1H), EMA 50 (4H), EMA 200 (chart timeframe) → Instant bullish/bearish signals
• VWAP → Bullish/Bearish/Neutral, based on last 5 candles for precision
• Daily Bias → Bullish or Bearish without switching charts
• Chop Filter → Detects if market is trending or choppy (last 10 candles)
• Works across all assets on TradingView — futures, forex, stocks, crypto, options
🔹 Why Traders Use It
• Eliminates chart clutter and analysis paralysis
• No more flipping timeframes — dashboard updates automatically
• Clear signals = faster decisions, cleaner trades
🚨 Subscription Access Only – Invite-Only Script
This indicator is available exclusively to subscribed members of VANTAGE-X. Access is tied to your TradingView username and managed manually by our team.
👉 Website coming soon

Daily 50‑ & 200‑SMA Ceiling Radar — EnhancedDescription:
This custom TradingView indicator, developed by Trader Malik and licensed under Trades Per Minute, is a powerful visual tool for identifying how price behaves relative to major daily moving averages — the 50-SMA and 200-SMA. It helps traders quickly understand key technical dynamics such as trend alignment, MA proximity, and short-term momentum sentiment — all displayed on a clean, minimal overlay with visual alerts and an adjustable data table.
FEATURES
1. Daily 50 & 200 Simple Moving Averages (SMA):**
- Displayed directly on the chart using distinct blue and orange lines.
- These serve as primary trend filters and support/resistance zones.
2. Price Highlighting:
- A red background flashes momentarily when the price crosses either the 50-SMA or 200-SMA.
- A green background fills the chart when price is above both MAs (bullish zone).
- A red background persists if price is below both MAs (bearish zone).
3. MA Gap Analysis Table:
- 50-SMA Row**: Shows % gap between 50-SMA and 200-SMA.
- 200-SMA Row**: Shows % gap between 200-SMA and 50-SMA.
- Sentiment Row**: Displays short-term trend bias based on the slope of the past 7 daily closes — Bullish, Neutral, or Bearish.
USER SETTINGS
Table Location: Choose between **Top Right** or **Bottom Right** of the chart.
Table Size: Select **Small**, **Medium**, or **Large** to suit screen preferences and layout aesthetics.
This script is **intellectual property of Trades Per Minute** and distributed by **Trader Malik** for use under licensing terms. Redistribution or repurposing without authorization is strictly prohibited.

Triple EMA (20, 50, 200) w/ LabelsI've combined the 20, 50, and 200 day exponential moving averages and added labels.
I created this due to finding EMA scripts that are either nothing but ugly to look at or have extra "features" that serve no purpose.
This gets rid of the clutter and gives a simple triple EMA with labels.
Labels are optional, you can turn them off in the settings.

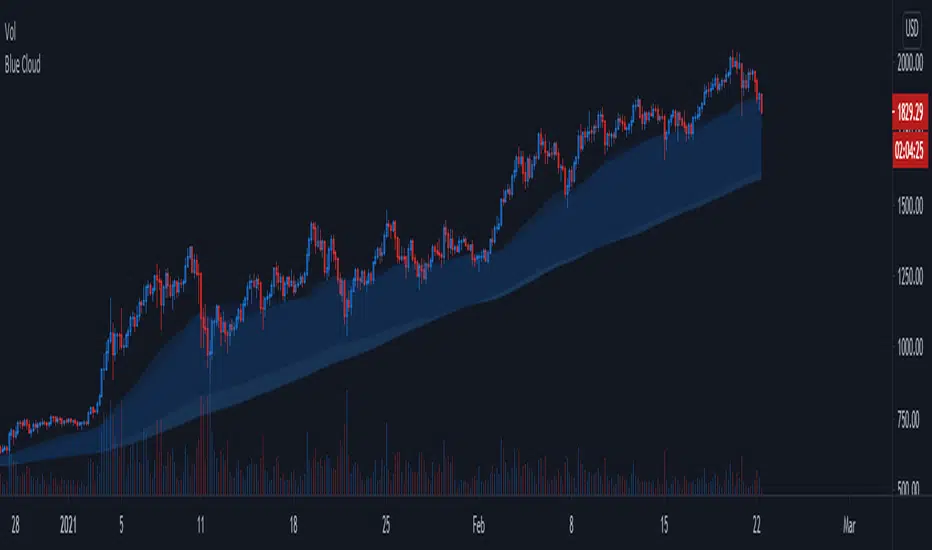
Blue CloudTrend Indicator
- Based on 4h 50/200 ma/ema
- Static, same accross all timeframes
- Works best with trending assets (espacially altcoins)
- 4h 50/200 ma/ema 's are transparent by default but can be enabled to improve visibility
Blue Cloud = Bullish, cloud often acts as support
Red Cloud = Bearish, cloud often acts as resistance


50% fibbonacci (Lirshah)50% fibonacci is an indicator created by lirshah programming team,
simplicity and showing short waves against the major trend and 100% none repainting signals are the strong points of this indicator.
the 50% fibonacci indicator is compatible with all markets and securities, and can be applied to different time frames.

50-100-200 Day SMAA simple indicator that display the 50, 100, and 200 Daily SMA. It will always display the DAILY 50,100, 200, regardless of the time frame you are looking at. Makes it easy to quickly display these key averages while also looking at smaller timeframes like 1H candles.


SMA 50/100 / 200Couldn't find a simple moving average that combined the three i was looking for so I made it. Nothing special.

50,100,200 MA by CryptoLife71(FIXED)Updated the code by CryptoLife71 so that the 200ma shows correctly.


