ASR / ADR by Vanya_zvwey
🇺🇦 Детальний Опис та Інструкція Користувача Індикатора ASR/ADR Grid
Цей індикатор є інструментом для візуалізації волатильності, який використовує історичні дані для прогнозування потенційних цінових рівнів розширення та корекції. Він будує сітки на основі середнього діапазону сесії (ASR) та середнього денного діапазону (ADR).
🔑 Ключові Концепції
ASR (Average Session Range): Середній діапазон High-Low, який зазвичай досягається протягом обраної торгової сесії (Азія, Лондон, Нью-Йорк) за останні N днів.
ADR (Average Daily Range): Середній діапазон High-Low, досягнутий протягом цілого 24-годинного торгового дня за останні N днів.
Синхронізація Часового Поясу: На відміну від багатьох індикаторів, цей індикатор залежить від введеного саме вами Session Timezone. Він гарантує, що ваші сесії та денні відкриття розраховуються правильно, незалежно від часового поясу вашого графіку.
⚙️ Посібник із Налаштування (Вхідні Параметри)
Налаштування згруповані для зручності:
1. General Settings (Загальні Налаштування)
Session Timezone: Виберіть часовий пояс, який використовуватиметься як єдиний орієнтир для всіх часів Start/End. Це може бути "UTC+2", "America/New_York" тощо.
Lookback Period (Days): Кількість днів, що використовується для обчислення середнього значення ASR та ADR.
Grid Direction:
"Up": Сітки будуються від поточного Low сесії/дня і розширюються вгору.
"Down": Сітки будуються від поточного High сесії/дня і розширюються вниз.
Grid Step %: Крок для внутрішніх ліній сітки (наприклад, 25% дасть лінії 25%, 50%, 75%).
2. Session Settings (Asia, London, New York)
Show : Увімкнення/вимкнення відображення сітки для конкретної сесії.
Start Time (HH:MM) / End Time (HH:MM): Час початку та кінця сесії, який відповідає вибраному вами Session Timezone.
3. ADR (Daily) Grid (Сітка Денного Діапазону)
Show ADR Grid: Увімкнення/вимкнення сітки, що охоплює весь день.
ADR Anchor: Визначає, від якої ціни починається відлік ADR (0%):
"Day Open": Як якір використовується ціна відкриття дня (00:00 у вашому часовому поясі).
"Day Low/High": Як якір використовується поточний денний екстремум (Low, якщо напрямок "Up", або High, якщо напрямок "Down").
📈 Використання та Інтерпретація
Сітка складається з рівнів від 0% до 100%, які візуалізують, наскільки далеко ціна просунулася щодо середнього історичного діапазону.
Структура Сітки
0% Рівень (Границя): Це якірна точка (High або Low) поточної сесії/дня, з якої починається розрахунок. Лінія суцільна.
100% Рівень (Границя): Це ціновий рівень, що дорівнює 0% Якір + ASR/ADR. Це статистично очікуваний максимальний рух. Лінія суцільна.
Внутрішні Рівні (Grid Step): Пунктирні лінії (25%, 50%, 75% тощо), які показують проміжні цілі або зони корекції.
Торгова Інтерпретація
Рух до 50%: Ціна досягла половини середнього діапазону.
Досягнення 100%: Ціна досягла "середнього" діапазону волатильності. Це часто служить хорошою ціллю для фіксації прибутку або точкою, де можна очікувати корекції/розвороту, оскільки рух вже відповідає історичним нормам.
Рух за межі 100% (Екстремум): Рух, що перевищує 100% ASR/ADR, вважається нетипово сильним або екстремальним.
🇬🇧 Detailed Description and User Guide for the ASR/ADR Grid Indicator
This indicator is a robust volatility visualization tool designed to project potential price extension and retracement levels based on historical data. It constructs price grids using the Average Session Range (ASR) and the Average Daily Range (ADR).
🔑 Key Concepts
ASR (Average Session Range): The average High-to-Low range typically achieved during a selected trading session (Asia, London, New York) over the last N days
ADR (Average Daily Range): The average High-to-Low range achieved during the entire 24-hour trading day over the last N days.
Timezone Synchronization: This is critical. The indicator relies on a single Session Timezone input to correctly calculate all session start/end times and daily opens, ensuring accuracy regardless of your charting platform's native exchange time.
⚙️ Setup Guide (Input Parameters)
The settings are organized into logical groups:
1. General Settings
Session Timezone: Select the timezone that will serve as the single reference point for all Start/End times below (e.g., "UTC+2", "America/New_York").
Lookback Period (Days): The number of preceding days used to compute the average ASR and ADR values.
Grid Direction:
"Up": The grids are anchored at the current session/day's Low and extend upwards.
"Down": The grids are anchored at the current session/day's High and extend downwards.
Grid Step %: The percentage increment for the inner grid lines (e.g., 25% will plot lines at 25%, 50%, 75%).
2. Session Settings (Asia, London, New York)
Show : Toggles the visibility of the grid for that specific session.
Start Time (HH:MM) / End Time (HH:MM): The start and end times for the session, which must correspond to your chosen Session Timezone. The script supports overnight sessions (e.g., starting at 22:00 and ending at 02:00 the next day).
3. ADR (Daily) Grid
Show ADR Grid: Toggles the visibility of the grid covering the entire trading day.
ADR Anchor: Determines the price point from which the ADR (0%) is measured:
"Day Open": The anchor is the day's opening price (at 00:00 in your chosen timezone).
"Day Low/High": The anchor is the current day's extreme (Low if Direction is "Up", or High if Direction is "Down").
📈 Usage and Interpretation
The grid levels, ranging from 0% to 100%, visualize how far the price has traveled relative to the average historical volatility for that specific period.
Grid Structure
0% Level (Border): This is the anchor point (High or Low) of the current session/day, serving as the starting reference for the calculation. This line is solid.
100% Level (Border): This is the price level equal to the 0% Anchor + ASR/ADR. It represents the statistically expected average maximum move. This line is also solid.
Inner Levels (Grid Step): These dotted lines (25%, 50%, 75%, etc.) serve as intermediate targets or potential zones for pullback.
Trading Interpretation
Reaching 50%: The price has achieved half of the average range.
Reaching 100%: The price has fulfilled the "average" volatility range. This level often acts as an excellent profit target or a point where you might expect correction or reversal, as the move has met historical norms.
Moving Beyond 100% (Extreme): A price move that exceeds 100% ASR/ADR is considered unusually strong or extreme volatility.
ADR

Watermark | Bar Time | Average Daily RangeMulti Info Panel & Watermark
Multi Info Panel & Watermark is a utility indicator that displays several pieces of chart information in a single, customizable panel. It is designed to support intraday and swing analysis by making key data—such as symbol details, date, and average daily range—easy to see at a glance, as well as providing simple tools for notes and backtesting.
Features
Watermark / Custom Note
Optional text overlay that can be used as a watermark or personal note.
Can display a strategy name, reminder, or any other user-defined label on the chart.
Ticker Info
Shows information about the currently active symbol on the chart (for example, symbol name and other basic details depending on the inputs).
Helps keep track of which market or pair is being analyzed, especially when using multiple charts.
Current Date
Displays the current date directly on the chart.
Useful for screenshots, journaling, and documenting analysis.
Average Daily Range (ADR)
Calculates the average daily range of the active symbol over a user-defined number of recent days.
Helps visualize how much price typically moves in a day, which can support position sizing, target setting, or volatility awareness within your own trading approach.
Open Bar Time Marker
Marks the open time of a selected bar (for example, a session open or a specific reference bar).
Primarily intended as a visual aid for manual backtesting and reviewing historical price action.
Usage
Use the watermark and ticker info to keep your charts labeled and organized.
Refer to the ADR readout to understand typical daily volatility of the instrument you are studying.
Use the date and open bar time marker when creating screenshots, trade journals, or when replaying historical sessions for review.
This script does not generate trading signals and does not guarantee any performance or results. It is provided solely as an informational and visualization tool. Always combine it with your own analysis, risk management, and decision-making. Nothing in this indicator or description should be considered financial advice.

Average Daily Range by EleventradesThis indicator calculates the Average Daily Range based on any number of past candles you choose, and it shows you the projected expansion for the current daily candle. You can also enable features like mean-reversion for large-range days, reversal thresholds, and filters for candles with big wicks. The full guide is already posted on YouTube along with a PDF.

ADR Daily Range + Volatility + KZs — SMC/ICT (@PueblaATH)ADR Daily Range + Volatility + KZs — SMC/ICT (@PueblaATH) is a complete intraday context and volatility HUD that plots market opens, killzones, previous period highs/lows, and a dynamic ADR/volatility dashboard. It is built to give SMC/ICT traders an at-a-glance view of when and where price is moving: sessions, overlaps, ranges, and distance to key levels, all on a single clean overlay.
What the Indicator Does
Market Opens (Tokyo, London, New York)
Professional-grade session open lines with:
Individually configurable open times per session and timezone.
Infinite vertical lines or height-limited extensions (custom tick offsets).
Fully styled labels: size, alignment, auto-background, manual background, and vertical offset.
Killzones & Session Overlaps
Precision-timed shaded boxes for:
Tokyo Killzone
London Killzone
New York Killzone
London–New York Overlap
Previous Period Levels (PDH/PWH/PMH & PDL/PWL/PML)
Robust daily/weekly/monthly high/low engine:
Accurate Previous Day / Week / Month Highs & Lows (Europe/Madrid reference).
Line length modes: infinite, N bars, or end-of-day projection.
Per-level colors + labeled markers placed to the right of price with custom horizontal/vertical spacing.
Timeframe & Weekend Filters
Keep charts clean by hiding components based on:
Custom timeframe ranges (hide opens or killzones on HTFs).
Weekend filters for opens, killzones, and ADR/table.
Optional override to display the HUD table across all timeframes.
Session Comparison Table (Top-Right HUD)
A compact, institutional-style session dashboard comparing:
Tokyo, London, New York — current open vs previous session and previous day.
Bullish/Bearish state with color-coded logic (+ optional ▲/▼ arrows).
Optional Δ% change column relative to previous day’s open.
ADR / Volatility Panel (24h Rolling Window)
A powerful real-time volatility module providing:
True 24-hour rolling high–low range.
SMA-based ADR calculation with automatic bar-count safety limits.
ADR% expansion metric with two thresholds + blinking color logic for volatility extremes.
Directional bias vs price 24 hours ago (Bullish/Bearish).
Optional metrics: distance to PDH/PDL (in price units) and absolute H–L / ADR values.
How to Use It
Set each session’s open time and killzone window according to your broker or desired timezone alignment.
Enable or disable session opens and killzones to frame the trading windows you prioritize (e.g., LDN Killzone or NY session expansion).
Activate key previous period levels (PDH/PDL, PWH/PWL, PMH/PML) and tune the line-length mode and label spacing to match your workflow.
Use timeframe & weekend filters to keep higher-timeframe charts clean while maintaining precise intraday visibility on lower timeframes.
Monitor the session comparison table to understand directional behavior relative to previous sessions and previous day opens.
Watch the ADR panel to classify the day as compressed, normal, or expanded—and anticipate potential reversion or continuation.
Originality & Credits Disclaimer
This indicator is an original work by @PueblaATH , created specifically for the tool ADR Daily Range + Volatility + KZs — SMC/ICT (@PueblaATH) and distributed under the MPL 2.0 license.
While the concepts implemented—session opens, killzones, ADR, and previous highs/lows—are public and widely known in the trading community, this script introduces a uniquely integrated framework that combines:
Multi-timezone session scheduling with dynamic TF/weekend filtering.
A modular PDH/PWH/PMH + PDL/PWL/PML engine with versatile projection and labeling controls.
A precise 24-hour volatility model tied to an ADR panel with extension thresholds, blinking alerts, and distance-to-PD metrics.
A multi-session comparative table that unifies Tokyo, London, and New York open data in real time.
This work does not reuse or repackage code from other authors. Any future adaptations from public sources will always include full, transparent credit and documentation.

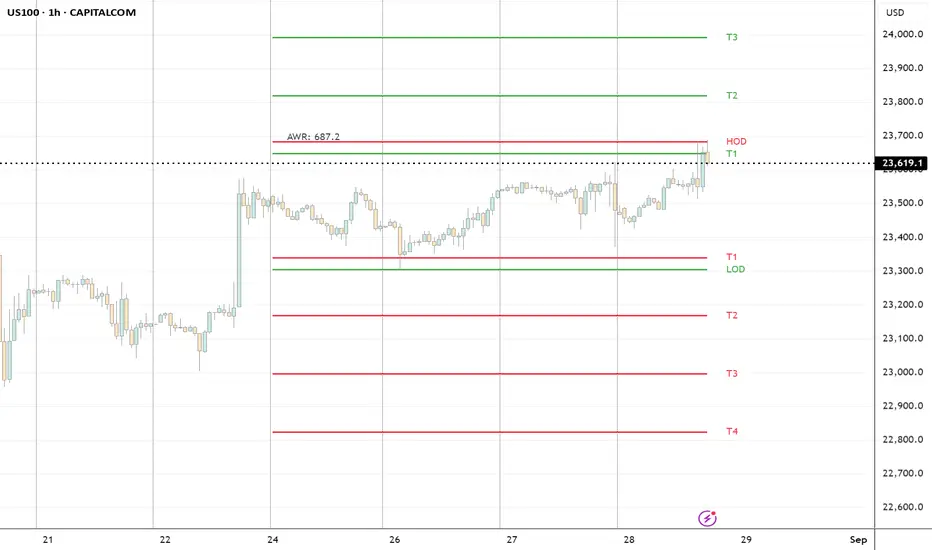
HTF Ranges - AWR/AMR/AYR [bilal]📊 Overview
Professional higher timeframe range indicator for swing and position traders. Calculate Average Weekly Range (AWR), Average Monthly Range (AMR), and Average Yearly Range (AYR) with precision projection levels.
✨ Key Features
📅 Three Timeframe Modes
AWR (Average Weekly Range): Weekly swing targets - Default 4 weeks
AMR (Average Monthly Range): Monthly position targets - Default 6 months
AYR (Average Yearly Range): Yearly extremes - Default 9 years
🎯 Dual Anchor Options
Period Open: Week/Month/Year opening price
RTH Open: First RTH session (09:30 NY) of the period
📐 Projection Levels
100% Range Levels: Upper and lower targets from anchor
Fractional Levels: 33% and 66% zones for partial targets
Custom Mirrored Levels: Set any percentage (0-200%) with automatic mirroring
Example: 25% shows both 25% and 75%
Example: 150% shows both 150% and -50%
📊 Information Table
Active range type (AWR/AMR/AYR)
Average range value for selected period
Current period range and percentage used
Distance remaining to targets (up/down)
Color-coded progress (green/orange/red)
🎨 Fully Customizable
Orange theme by default (differentiates from daily indicators)
Line colors, styles (solid/dashed/dotted), and widths
Toggle labels on/off
Adjustable lookback periods for each timeframe
Independent settings for each range type
⚡ Smart Features
Lines start at actual period open (not fixed lookback)
Automatically tracks current period high/low
Works on any chart timeframe
Real-time range tracking
Alert conditions when targets reached or exceeded
🎯 Use Cases
AWR (Weekly Ranges):
Swing trade targets (3-7 day holds)
Weekly support/resistance zones
Identify weekly trend vs rotation
Compare daily moves to weekly context
AMR (Monthly Ranges):
Position trade targets (2-4 week holds)
Monthly breakout levels
Institutional-level zones
Earnings play targets
AYR (Yearly Ranges):
Major reversal zones
Long-term support/resistance
Identify macro trend strength
Annual high/low projections
💡 Trading Strategies
AWR Strategy (Swing Trading):
Week opens near AWR lower level = potential long setup
Target AWR 66% and 100% levels
Week hits AWR upper in first 2 days = watch for reversal
Use fractional levels as scale-in/scale-out points
AMR Strategy (Position Trading):
Month opens near AMR extremes = fade setup
Month breaks AMR in week 1 = expansion (trend) month
Target opposite AMR extreme for swing positions
Use 33%/66% for partial profit taking
AYR Strategy (Long-term Context):
Price near AYR extremes = major reversal zones
Breaking AYR levels = historic moves (rare)
Use for macro trend confirmation
Great for yearly forecasting and planning
📊 Range Interpretation
<33% Range Used: Early in period, room for expansion
33-66% Range Used: Normal progression
66-100% Range Used: Extended, approaching extremes
>100% Range Used: Expansion period - trending or high volatility
⚙️ Settings Guide
Lookback Periods:
AWR: 4 weeks (standard) - adjust to 8-12 for smoother average
AMR: 6 months (standard) - seasonal patterns
AYR: 9 years (standard) - captures full cycles
Anchor Type:
Period Open: Use for clean week/month/year open reference
RTH Open: Use if you only trade day session, ignores overnight gaps
Custom Levels:
25% = quartile targets
75% = three-quarter targets
80% = "danger zone" for reversals
111% = extended breakout target
🔄 Combine with ADR Indicator
Run both indicators together for complete multi-timeframe analysis:
ADR for intraday precision
AWR/AMR/AYR for swing/position context
See if today's ADR move is significant in weekly/monthly context
Multi-timeframe confluence = highest probability setups
💼 Ideal For
Swing Traders: Use AWR for 3-10 day holds
Position Traders: Use AMR for 2-8 week holds
Long-term Investors: Use AYR for macro context
Index Futures Traders: ES, NQ, YM, RTY
Multi-timeframe Analysis: Combine with daily ADR

Average Daily Range [Blaz]Version 1.0 – Published October 2025: Initial release
1. Overview & Purpose
The Average Daily Range is an advanced volatility assessment tool designed to give traders a clear, real-time view of the market's expected daily movement. It calculates the average range between daily highs and lows over a user-defined historical period and projects this average onto the current trading session.
By visualising the potential high and low boundaries for the day, this indicator assists in setting realistic profit targets, managing risk effectively, and identifying when price action is becoming overextended relative to its recent volatility profile. It is an essential tool for day traders and swing traders across all markets, including Forex, Stocks, Crypto, Futures, and Commodities.
2. Core Functionality & Key Features
The indicator provides a dynamic, multi-faceted analysis of daily volatility:
Historical ADR Calculation: Automatically computes the Average Daily Range based on the specified number of previous trading days (configurable from 1 to 20).
Real-Time Range Tracking: Monitors and displays the current day's live price range as it develops.
Percentage Used Metric: Shows the percentage of the historical ADR that the current day's range has already consumed, providing an immediate gauge of remaining volatility potential.
Remaining Range Projection: Visually highlights the potential upward and downward movement remaining to meet the average range, displayed as semi-transparent areas on the chart.
Daily Open Reference: Plots customisable vertical separation lines and horizontal price lines at the daily open to clearly anchor the current session's price action.
3. Visual Components & Analytical Insights
A fully configured Average Daily Range setup displays several key analytical components that work together to provide a comprehensive volatility overview.
3.1. Information Table
A highly customizable data table provides a concise summary of all critical metrics at a glance:
Historical Ranges: Displays the individual daily ranges for the selected lookback period.
ADR Value: The calculated average range.
Today's Range: The live, developing range for the current session.
% Used: A colour-coded percentage (turning orange upon exceeding 100% and red upon exceeding 150%) showing how much of the average volatility has been consumed.
3.2. Visual Range Projections
Remaining Range Zones: When the current day's range is below the historical average, semi-transparent zones extend from the current day's extreme high and low, illustrating the additional movement required to reach the ADR. This provides an instant visual cue for potential target zones.
Daily Open Markers: Clean, customisable lines mark the start of each trading day (vertical line) and the daily open price (horizontal line), helping to contextualise intraday price moves.
4. Input Parameters and Settings
4.1. General Settings
Lookback: Set the number of days used to calculate the Average Daily Range (1-20).
Set Alert: Configure alerts to be notified when the current day's range consumes a significant portion (e.g., 100% or more) of the historical ADR.
4.2. Table Customization
Visibility & Style: Toggle the table and historical data on/off. Fully customise the header and body colours, text colours, border style, and font sizes.
Placement & Orientation: Precisely position the table anywhere on the chart (Top/Bottom/Centre, Left/Right) and choose between Horizontal or Vertical layout to best suit your chart layout.
4.3. Visual Style Controls
Remaining Range: Toggle the projection zones on/off and customise their colour and transparency.
Daily Open Markers: Independently control the visibility, colour, style, and width of the daily separation line and the open price line.
5. Protected Logic & Original Design
The Average Daily Range indicator incorporates proprietary logic for efficiently tracking intraday extremes, managing historical data arrays, and dynamically rendering visual elements. The closed-source nature of this tool protects the author's original code structure and optimisation techniques, particularly the real-time area fill projection logic for the remaining daily range and the dynamic table management system. This ensures the indicator remains performant and reliable while being freely accessible to the entire TradingView community.
6. Disclaimer & Terms of Use
This indicator, titled Average Daily Range , has been independently developed by the author. The code and its structural logic are original and were written entirely from scratch to reflect a unique and efficient approach to volatility analysis. The internal mechanics were written from scratch and are not based on any publicly available script or third-party code.
This tool is provided solely for educational and informational purposes. It is not intended as financial advice, investment guidance, or a specific recommendation to buy or sell any financial instrument. The indicator is designed to assist with technical analysis based on volatility but does not guarantee accuracy or profitability.
Trading financial markets involves significant risk, including the possibility of loss of capital. By using this indicator, you acknowledge and accept that you are solely responsible for any decisions you make and for all trading outcomes. No part of this script should be considered a signal or assurance of success in the market.

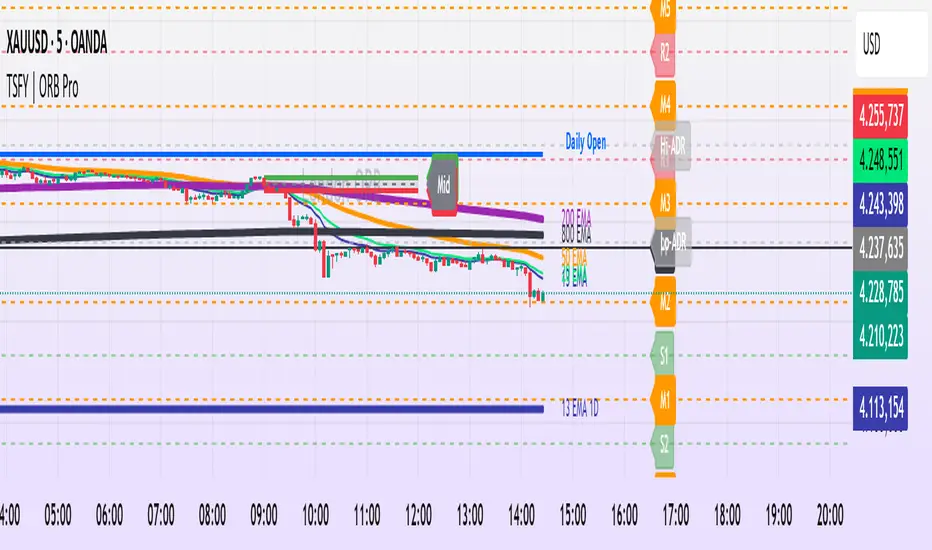
Tradisfy | TSFY | ORB Pro**TSFY | ORB Pro**
Introduction
TSFY | ORB Pro combines the classic Opening Range Breakout (ORB) logic with professional market structure tools such as EMAs, the Daily Open, ADR, and Pivot Points.
The goal: A clean and logically structured intraday visualization of volatility, trend, and key price zones — without visual clutter.
Timezone: Europe/Berlin
---
Core Features
Multi-Session ORB: Separate Opening Ranges for London, Gold, and New York sessions with ORH, ORL, and Mid levels, optionally extendable to the end of the trading day.
EMAs (Intraday & Daily): Adaptive trend filters from 4 to 800 periods plus Daily 13/50/200 EMAs for higher-timeframe structure context.
Classic Pivots: Automatic calculation of daily PP, R, S, and Mid levels with fully customizable colors, styles, and extensions.
Daily Open: Marks the daily opening price as a bias reference point.
ADR (Average Daily Range): Calculates the average true range of the last X days, optionally anchored to the Daily Open with an optional 50% midpoint.
---
Interpretation
Break above ORH → bullish momentum; break below ORL → bearish weakness.
Combine ORB zones with EMAs, Pivots, or ADR for higher confluence.
Daily Open provides intraday bias, ADR defines realistic target zones.
Reactions around R/S levels or OR Mid often indicate short-term turning points.
---
Usage
Use the ORB zone as the basis for breakout, retest, or mean-reversion setups.
Plan realistic take-profit zones using ADR and Pivot levels.
Daily EMAs define the overall market bias.
All components can be toggled on or off individually.
---
Notes
Optimized for intraday ORB trading.
No alerts integrated (yet).
All colors, line widths, and transparency levels are fully customizable.
Non-repainting — lines are extended forward, not redrawn.
Performance-friendly despite multiple visual components (max. 500 lines/labels).
---
TSFY | ORB Pro is a complete framework for modern intraday traders who want to combine session logic, trend filters, and market structure into one clean and efficient tool.
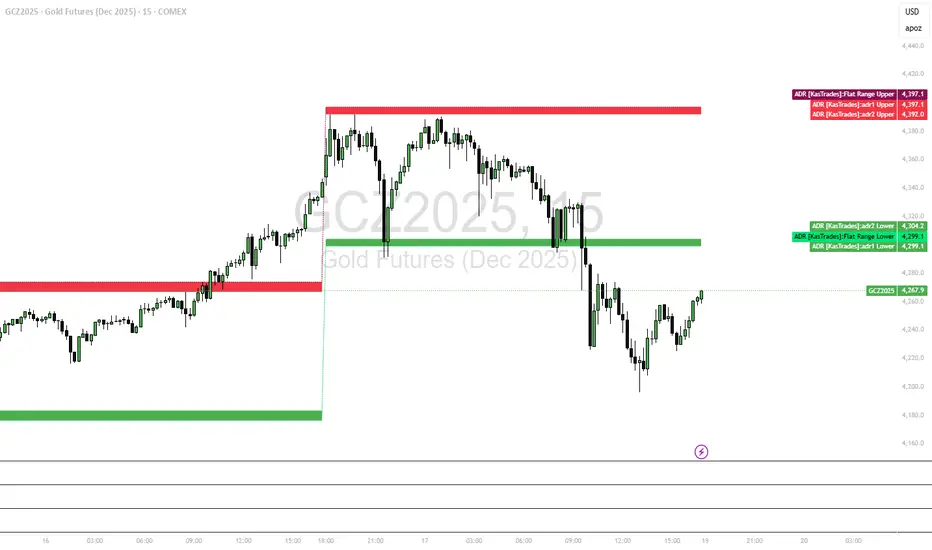
ADR - Average Daily Range [KasTrades]This is an Average Daily Range (ADR) indicator.
There are two settings for ADR:
Two Look back period ADR range (e.g. 7 and 14 days)
One Look back period ADR (e.g. 5 days only)
Two day ADR ranges are typically used in equities and index futures whereas one day ADR is typically used in forex.
The opening time by default is 17:00 New York (Eastern) time. The ranges are always calculated from the opening price of the first bar on the respected timeframe.

ADR [KasTrades]This ADR indicator has 2 options: a Range of ADR, such as 7 and 14 which is typically used for indexes, index futures and equities, or a single ADR such as a 5 day which is typically used for forex.
The session start time is 17:00 ET (NY Time) by default, this is adjustable.
You can adjust the ADR days to different ranges such as 5 and 10, or a single ADR day such as 7.
Colors of the ADR high and low are also adjustable.
Swing Data - SimplifiedThe swing data indicator by jfsrev but simplified. Thank you jfsrev for your work!
ADR% / CDR% Range Analyzer - PajameinThe "ADR%/CDR% Range Analyzer" is a versatile TradingView indicator designed for traders who want to monitor and compare the "Average Daily Range (ADR%)" and "Current Daily Range (CDR%)" in real-time. ADR% represents the average percentage range (high-low relative to low) over a user-defined number of daily bars, helping you gauge a stock's typical volatility. CDR% shows the current session's range as a percentage, either intraday (customizable from start to end price) or full daily, allowing you to assess how the current bar's movement stacks up against historical norms.
Key features include:
- "Visual Comparison": Displays both values as clean labels on the chart with customizable positions (separate or combined).
- "Dynamic Background Coloring": CDR% label background changes color based on its relation to ADR%—light green for low volatility (< low threshold), light blue for neutral (between thresholds), and light red for high volatility (> high threshold). This helps quickly spot expansion or contraction in daily moves.
- "Flexibility": Works on any timeframe, with options for intraday customization and anti-clipping adjustments for multi-pane layouts.
This indicator is ideal for day traders, swing traders, or anyone tracking volatility breakouts, range-bound setups, or risk management based on expected daily moves.
Input Settings Guide
Here's a breakdown of each setting and how it enhances your trading workflow:
- "Show ADR%" (Boolean, default: true)
Toggle to display/hide the ADR% label. Use this to declutter your chart when focusing solely on current range.
- "Show CDR%" (Boolean, default: true)
Toggle to display/hide the CDR% label. Ideal for charts where you only need historical average or current metrics.
- "ADR% Length" (Integer, default: 20, min: 1)
Number of daily bars for averaging the range percentage. Shorter lengths (e.g., 10) for recent volatility; longer (e.g., 50) for broader trends.
- "CDR%: Start" (Source, default: low)
Starting price for intraday CDR% (e.g., open, previous close). Customize for specific range measurements like gap fills.
- "CDR%: End" (Source, default: high)
Ending price for intraday CDR% (e.g., low, close). Pair with Start for targeted ranges, like open-to-low for downside capture.
- "Intraday Display" (String dropdown: "Intraday CDR%", "Daily CDR%", default: "Daily CDR%")
Switch between real-time intraday calculation (dynamic updates) or fixed daily value (stable, non-repainting).
- "Low Threshold %" (Float, default: 40.0, range: 0-100)
Percentage of ADR% below which CDR% gets the low (green) background. Lower it (e.g., 30%) for stricter low-volatility alerts.
- "High Threshold %" (Float, default: 60.0, range: 0-100)
Percentage of ADR% above which CDR% gets the high (red) background. Raise it (e.g., 70%) to highlight only extreme expansions.
- "ADR% Text Color" (Color picker, default: black)
Foreground color for ADR% text. Choose contrasting colors for dark/light themes.
- "CDR% Text Color" (Color picker, default: black)
Foreground color for CDR% text. Ensures readability over dynamic backgrounds.
- "Low CDR% Background (below low threshold)" (Color picker, default: light green with 70% transparency)
Background for subdued ranges. Adjust opacity for subtlety.
- "Mid CDR% Background (between thresholds)" (Color picker, default: light blue with 70% transparency)
Neutral background for typical moves.
- "High CDR% Background (above high threshold)" (Color picker, default: light red with 70% transparency)
Alert-style background for breakouts.
- "Cell Height %" (Integer, default: 8, range: 1-20)
Vertical padding for labels as a percentage of chart height. Increase (e.g., 12) in multi-pane layouts to prevent text clipping; decrease for compact views.
- "ADR% Position" (String dropdown: Top/Bottom/Middle Left/Right/Center, default: Bottom Right)
Placement of ADR% label. Use separate positions for side-by-side comparison.
- "CDR% Position" (String dropdown: Top/Bottom/Middle Left/Right/Center, default: Bottom Right)
Placement of CDR% label. Matching positions auto-stacks them vertically.
- "Text Size" (String dropdown: Tiny/Small/Normal/Large, default: Normal)
Font size for labels. "Small" for dense charts; "Normal" for clarity.
Usage Tips
- "Volatility Trading": Set thresholds to 50%/80% for spotting range expansions during news events.
- "Multi-Timeframe": Apply on 5-min charts with daily ADR for intraday targets (e.g., aim for 80% of ADR).
- "Customization": For forex/crypto, tweak Start/End to session opens. Test in replay mode to verify non-repainting.
- "Limitations": Intraday mode updates live but may not repaint until bar close; daily mode is fixed.

Sessions [Trade Tribe HQ]Color-coded session ranges with ADR% labels to help you trade smarter, not harder.
This tool marks New York, London, Tokyo, and Sydney sessions, showing their ranges, highs/lows, VWAPs, and ADR%.
🔹 Key Features
Colored session boxes (NY, London, Tokyo, Sydney)
Session highs & lows, VWAP, and trendlines
Dashboard showing active sessions, volume, and %ADR
ADR% labels at session close
🔹 How It Helps
Spot session traps, moves, and reversals faster
Manage expectations using ADR% (no chasing over-extended moves)
Identify overlap zones (London → NY) for volatility spikes
Simplify cycle tracking across global markets
Market Sessions Marker—making it easy to see where the energy has been spent and where opportunity is building next.
Created with ❤️ by TraderChick – part of the Trade Tribe HQ community.
If you found this tool useful, check out my profile for more strategies, classes, and resources.

ADR H/L + Bull/Bear TargetsThis indicator calculates the Average Daily/Weekly Range over any given period and plots the Bull and Bear targets for that Session Daily/Weekly or both. Classic targets are calculated at ADR/AWR +/- .50 .75 1.00 1.25. Green is for the + and RED is for the - but colors can been changed to suit.
In 'Settings' there is the ability to toggle:
1. How many sessions you want to plotting on your chart.
2. Switching ON/OFF Bull/Bear targets.
3. Line color/thickness
4. Ability to offset Header for ADR/AWR vertically.
5. I've put in there a FIB option as well as Classic. FIB counts are at .382 .50 .618 1.00 of ADR and labelled as such.
ACR(Average Candle Range) With TargetsWhat is ACR?
The Average Candle Range (ACR) is a custom volatility metric that calculates the mean distance between the high and low of a set number of past candles. ACR focuses only on the actual candle range (high - low) of specific past candles on a chosen timeframe.
This script calculates and visualizes the Average Candle Range (ACR) over a user-defined number of candles on a custom timeframe. It displays a table of recent range values, plots dynamic bullish and bearish target levels, and marks the start of each new candle with a vertical line. All calculations update in real time as price action develops. This script was inspired by the “ICT ADR Levels - Judas x Daily Range Meter°” by toodegrees.
Key Features
Custom Timeframe Selection: Choose any timeframe (e.g., 1D, 4H, 15m) for analysis.
User-Defined Lookback: Calculate the average range across 1 to 10 previous candles.
Dynamic Targets:
Bullish Target: Current candle low + ACR.
Bearish Target: Current candle high – ACR.
Live Updates: Targets adjust intrabar as highs or lows change during the current candle.
Candle Start Markers: Vertical lines denote the open of each new candle on the selected timeframe.
Floating Range Table:
Displays the current ACR value.
Lists individual ranges for the previous five candles.
Extend Target Lines: Choose to extend bullish and bearish target levels fully across the screen.
Global Visibility Controls: Toggle on/off all visual elements (targets, vertical lines, and table) for a cleaner view.
How It Works
At each new candle on the user-selected timeframe, the script:
Draws a vertical line at the candle’s open.
Recalculates the ACR based on the inputted previous number of candles.
Plots target levels using the current candle's developing high and low values.
Limitation
Once the price has already moved a full ACR in the opposite direction from your intended trade, the associated target loses its practical value. For example, if you intended to trade long but the bearish ACR target is hit first, the bullish target is no longer a reliable reference for that session.
Use Case
This tool is designed for traders who:
Want to visualize the average movement range of candles over time.
Use higher or lower timeframe candles as structural anchors.
Require real-time range-based price levels for intraday or swing decision-making.
This script does not generate entry or exit signals. Instead, it supports range awareness and target projection based on historical candle behavior.
Key Difference from Similar Tools
While this script was inspired by “ICT ADR Levels - Judas x Daily Range Meter°” by toodegrees, it introduces a major enhancement: the ability to customize the timeframe used for calculating the range. Most ADR or candle-range tools are locked to a single timeframe (e.g., daily), but this version gives traders full control over the analysis window. This makes it adaptable to a wide range of strategies, including intraday and swing trading, across any market or asset.

ADR Plots + OverlayADR Plots + Overlay
This tool calculates and displays Average Daily Range (ADR) levels on your chart, giving traders a quick visual reference for expected daily price movement. It plots guide levels above and below the daily open and shows how much of the day's typical range has already been covered—all in one interactive table and on-chart overlay.
What It Does
ADR Calculation:
Uses daily high-low differences over a user-defined period (default 14 days), smoothed via RMA, SMA, EMA, or WMA to calculate the average daily range.
Projected Levels:
Plots four reference levels relative to the current day's open price:
+100% ADR: Open + ADR
+50% ADR: Open + 50% of ADR
−50% ADR: Open − 50% of ADR
−100% ADR: Open − ADR
Coverage %:
Tracks intraday high and low prices to calculate what percentage of the ADR has already been covered for the current session:
Coverage % = (High − Low) ÷ ADR × 100
Interactive Table:
Shows the ADR value and today's ADR coverage percentage in a customizable table overlay. The table position, colors, border, transparency, and an optional empty top row can all be adjusted via settings.
Customization Options
Table Settings:
Position the table (top/bottom × left/right).
Change background color, text color, border color and thickness.
Toggle an empty top row for spacing.
Line Settings:
Choose color, line style (solid/dotted/dashed), and width.
Lines automatically reposition each day based on that day's open price and ADR calculation.
General Inputs:
ADR length (number of days).
Smoothing method (RMA, SMA, EMA, WMA).
How to Use It for Trading
Measure Daily Movement: Instantly know the expected daily price range based on historical volatility.
Identify Overextension: Use the coverage % to see if the market has already moved close to or beyond its typical daily range.
Plan Entries & Exits: Align trade targets and stops with ADR levels for more objective intraday planning.
Visual Reference: Horizontal guide lines and table update automatically as new data comes in, helping traders stay informed without manual calculations.
Ideal For
Intraday traders tracking daily volatility limits.
Swing traders wanting a quick reference for expected price movement per day.
Anyone seeking a volatility-based framework for planning targets, stops, or identifying extended market conditions.

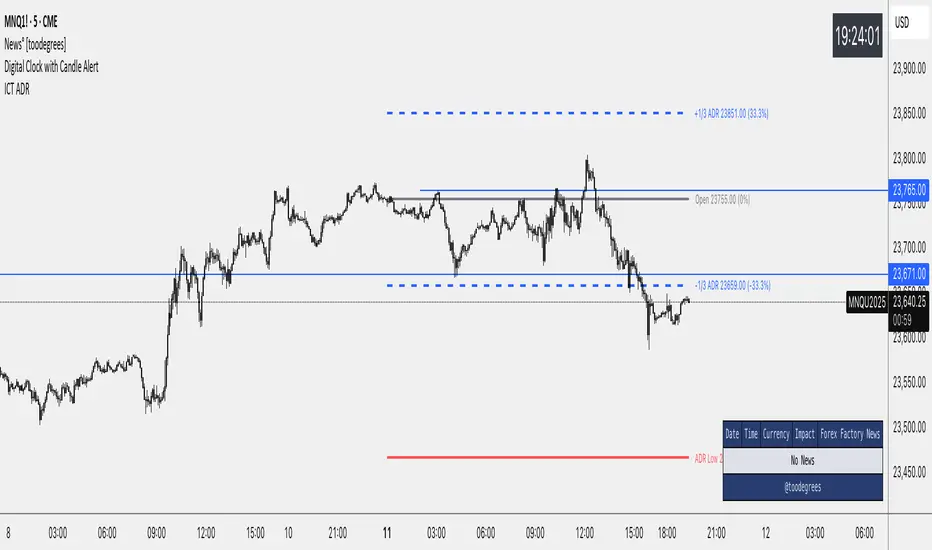
ICT Average Daily Range (ADR)📊 ICT Average Daily Range (ADR) Indicator
This indicator implements the Average Daily Range (ADR) concept taught by ICT (Inner Circle Trader). It calculates the average range of previous trading days and projects key levels for the current session, helping traders identify high-probability targets and reversal zones.
━━━━━━━━━━━━━━━━━━━━━━━━━━━━━━━━━━━━━━━━
✨ KEY FEATURES
- Accurate ADR Calculation - Uses only completed trading sessions (excludes current incomplete day)
- ICT Judas Swing Levels - Highlights the critical 1/3 ADR levels where institutional manipulation often occurs
- Two Calculation Modes - New York Midnight (ICT recommended) or Classic Daily
- Customizable Fractional Levels - 1/3, 2/3, 25%, 50%, 75% of ADR
- Smart Labels - Display price levels and percentage from open
- Flexible Visual Style - Separate line styles for different level groups
- Session Dividers - Optional vertical lines at session start
━━━━━━━━━━━━━━━━━━━━━━━━━━━━━━━━━━━━━━━━
📅 WEEKEND SESSION HANDLING
How Forex Sessions Work:
- Monday-Thursday: Full 24-hour sessions
- Friday: Partial session (00:00 to ~17:00 NY time)
- Sunday: Partial session (~17:00 NY to Monday 00:00)
- Saturday: No trading
Impact on ADR:
Both Friday and Sunday are partial sessions which can lower your ADR average. For example: Mon-Thu average 100 pips, Fri 70 pips, Sun 30 pips = 5-day ADR of 80 pips.
Other Markets:
- Crypto: 24/7 trading, no partial days
- Futures/Stocks: No Sunday session
━━━━━━━━━━━━━━━━━━━━━━━━━━━━━━━━━━━━━━━━
🎓 ICT CONCEPTS
Average Daily Range (ADR)
Statistical measure of average price movement per day. Acts as a "magnet" for price - markets tend to fulfill their ADR.
1/3 ADR Levels - "Judas Swing"
ICT's signature concept for identifying manipulation zones. Price often sweeps these levels to trap retail traders before reversing. High-probability reversal areas during London/NY sessions.
━━━━━━━━━━━━━━━━━━━━━━━━━━━━━━━━━━━━━━━━
⚙️ SETTINGS GUIDE
ADR Period: Number of days for calculation (default 5)
- Lower values = More responsive
- Higher values = Smoother levels
Calculation Mode:
- New York Midnight - ICT standard, best for Forex
- Classic Daily - Exchange timezone
Level Display:
- ADR High/Low - Primary targets
- 1/3 Levels - Judas Swing zones
- 2/3 Levels - Trending day targets
- Quarter Levels - 25% and 75%
- 50% Level - Mid-range
Visual Options:
- Separate line styles for each level group
- Customizable colors and width
- Optional labels with price/percentage
━━━━━━━━━━━━━━━━━━━━━━━━━━━━━━━━━━━━━━━━
💡 TRADING TIPS
1. Early Session: If price moves to 1/3 ADR quickly, watch for Judas Swing reversal
2. Mid Session: Use 2/3 levels as continuation targets in trending markets
3. Late Session: ADR completion often marks session extremes
4. Risk Management: Use fractional levels for scaling positions
5. Confluence: Combine with Fair Value Gaps, Order Blocks, and Liquidity Pools
Best Timeframes: 15m, 30m, 1H, 4H for intraday trading
━━━━━━━━━━━━━━━━━━━━━━━━━━━━━━━━━━━━━━━━
📝 NOTES
- Based on concepts taught by ICT (Inner Circle Trader)
- Requires at least 5 completed sessions for full accuracy
- ICT suggested using "New York Midnight" mode
- Weekend sessions handled based on actual market hours
- Be aware that Friday/Sunday partial sessions may lower ADR average
Created with focus on clean implementation and ICT's core teachings.
Average Daily Range ADR by thSpecial for Amer and ATR testing and some text for description which I will add a little bit later because beatiful tv can't pass my indicator to be published
Price Extension from 8 EMAOverview
This indicator can be used to see how far away the price is from the 8 EMA. It compares this to the Average Daily Range % to see if the stock may be overextended. The "Extension Multiplier" represents how far the stock is extended away from the 8 EMA.
Core Concept
This indicator is best used for breakout trades that are trying to make sure they are not chasing the stock.
How to Use This Indicator
This tool is primarily intended for analyzing daily charts of individual stocks and is often used by breakout traders to evaluate potential entry areas.
If the stock is far away from the 8 EMA, it is likely not ready to break out. If it is close to the 8ema, it could be ready to move higher.
This indicator can also be used in the opposite way. For example, shorting or puts.
Understanding the colors
Green (Not Extended): Indicates the price is close to the 8 EMA. This often corresponds to periods of consolidation.
Yellow (Slightly Extended): The price is beginning to move away from the 8 EMA.
Orange (Extended): The price has moved a considerable distance from the 8 EMA.
Red (Very Extended): The price is at an extreme distance from the 8 EMA, historically increasing the likelihood of a pullback or consolidation.
Settings
Info Row Position: Adjusts the vertical position of the display table on the chart. Useful when using other indicators.
ADR Length: Sets the lookback period for calculating the Average Daily Range. Or the average range % for different timeframes.
Timeframe: Determines the timeframe for the EMA and ADR calculation (the default is Daily).

Haven Average Daily RangeOverview
This indicator is an enhanced version of the traditional ADR tool that adapts to intraday price movements. Unlike static ADR levels, this indicator dynamically adjusts its range boundaries based on real-time price action while maintaining the original ADR calculation framework.
Key Features
ADR calculation based on multiple periods (5, 10, and 20 days)
ADR levels displayed with automatic style changes upon range reach
Customizable display settings (color, line style)
Price labels for better visualization
The indicator helps traders assess the instrument's volatility, identify potential reversal zones, and plan daily trading targets.
Suitable for all timeframes up to D1 and any trading instrument.
How It Works
Session Start (UTC+0): Calculates ADR based on historical data and sets initial High/Low levels
Dynamic Phase: Monitors price action and adjusts the opposite boundary (ADR Low or High) when new extremes are reached.
When price creates new Day high price above the opening price, the ADR Low level moves upward proportionally.
When price creates new Day low price below the opening price, the ADR High level moves downward proportionally.
Completion Phase: Stops adjustments and highlights breach when price reaches either boundary
Trading Application
Entry and Exit Signals
The ADR boundaries serve as key decision points for trade execution. When price approaches the upper ADR boundary, it often signals a potential selling zone, particularly when confluence exists with other overbought indicators such as RSI divergence or resistance levels. Conversely, price reaching the lower ADR boundary frequently indicates potential buying opportunities, especially when supported by oversold conditions or support confluences.
Trend Continuation Assessment
One of the most valuable applications is gauging the probability of continued directional movement. When the current session's price action has not yet reached either ADR boundary, statistical probability favors trend continuation in the established direction. This information helps traders stay with profitable positions longer rather than exiting prematurely.
Reversal and Consolidation Zones
The visual color change to orange when ADR boundaries are reached provides immediate feedback that the normal daily range has been exhausted. At this point, the probability of trend reversal or sideways consolidation increases significantly. This signal helps traders prepare for potential position adjustments or new counter-trend opportunities.

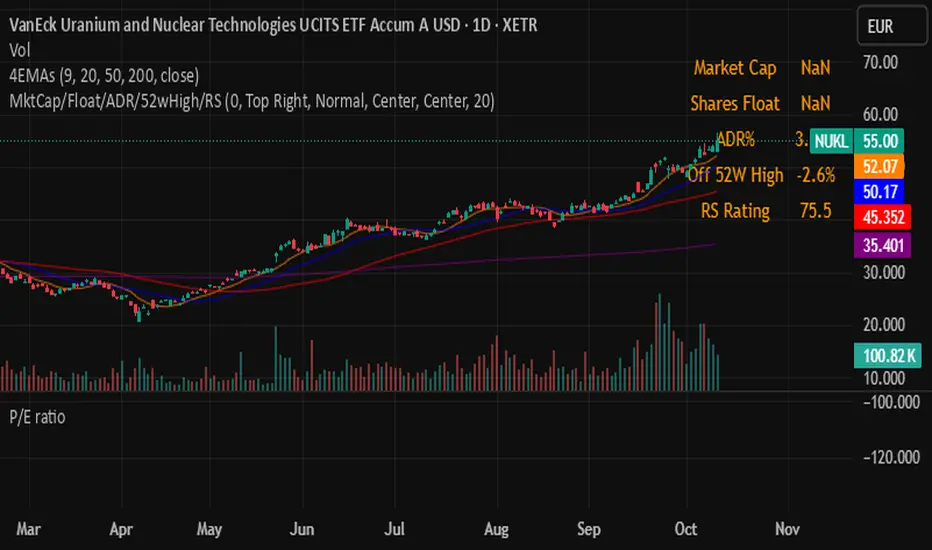
ATR% Multiple from MAThis indicator builds upon the original idea by jfsrevg of using the ATR% multiple from a daily 50-period moving average to highlight when a stock or instrument is extended relative to its own volatility. My version expands on this by incorporating an ADR% (Average Daily Range percentage) volatility filter, which helps refine the signals to adapt better to different instruments and timeframes.
What it does:
• Calculates the 50-period simple moving average (SMA) using daily data as the baseline trend reference.
• Measures the instrument’s Average True Range (ATR) relative to the current close (ATR%).
• Uses this ratio to identify when an instrument is significantly extended above its average volatility-based range.
• Adds a dynamic ADR% filter — computed as the average daily range divided by the daily close — to adjust the extension threshold dynamically based on recent price volatility.
• Plots small circles above price bars when extension conditions are met, signaling potential overbought conditions.
•The script works on both daily and weekly timeframes, but all volatility calculations are based on daily data to ensure consistency.
How to use:
• Traders can use this indicator to spot when a stock or instrument is significantly stretched relative to its own volatility, which may signal a good time to scale out or manage risk.
• The dynamic ADR% filter helps reduce false positives by adjusting thresholds based on market conditions.
• Use the customizable settings for ATR length, SMA length, and ADR length to fine-tune the indicator for your preferred instruments.
Original Contributions:
• Integrated an ADR% filter that refines the extension threshold based on real-time volatility.
• Added dynamic thresholds that adapt to market conditions, making the indicator more reliable across different instruments and timeframes.
• Maintained daily volatility calculations while allowing signals to appear on both daily and weekly charts.

Daily ADR TableDaily ADR Table Indicator
The Daily Average Daily Range (ADR) Table displays real-time volatility statistics directly on your chart. It shows both the current day's range and the historical average daily range as percentages of the current price, providing essential volatility metrics for trading decisions.
The indicator tracks today's range in real-time throughout the trading session using session-based calculations to ensure accuracy. It compares this against a customizable historical average (default 20 days, adjustable from 1-500 days) to help traders assess whether current volatility is above or below normal levels.
All values are displayed as percentages for easy comparison across different price levels and formatted to two decimal places for precision. The table position, text size, alignment, and colors are fully customizable with nine position options and professional default styling optimized for readability.
This indicator is valuable for day traders, swing traders, and market analysts who need to quickly assess current market volatility relative to historical norms. It assists in position sizing decisions, setting stop losses, and identifying potential breakout or consolidation scenarios based on range expansion or contraction.

ADR, ATR & VOL OverlayThis is a combined version of 2 of my other indicators:
ADR / ATR Overlay
VOL / AVG Overlay
This indicator will display the following as an overlay on your chart:
ADR
% of ADR
ADR % of Price
ATR
% of ATR
ATR % of Price
Custom Session Volume
Average For Selected Session
Volume Percentage Comparison
Description:
ADR : Average Day Range
% of ADR : Percentage that the current price move has covered its average.
ADR % of Price : The percentage move implied by the average range.
ATR : Average True Range
% of ATR : Percentage that the current price move has covered its average.
ATR % of Price : The percentage move implied by the average true range.
Custom Session Volume : User chosen time frame to monitor volume
Average For Selected Session : Average for the custom session volume
Volume Percentage Comparison : Current session compared to the average (calculated at session close)
Options:
ADR/ATR:
Time Frame
Length
Smoothing
Volume:
Set Custom Time Frame For Calculations
Set Custom Time Frame For Average Comparison
Set Custom Time Zone
Table:
Enable / Disable Each Value
Change Text Color
Change Background Color
Change Table location
Add/Remove extra row for placement
ADR / ATR Example:
The ADR and ATR can be used to provide information about average price moves to help set targets, stop losses, entries and exits based on the potential average moves.
Example: If the "% of ADR" is reading 100%, then 100% of the asset's average price range has been covered, suggesting that an additional move beyond the range has a lower probability.
Example: "ADR % of Price" provides potential price movement in percentage which can be used to asses R/R for asset.
Example: ADR (D) reading is 100% at market close but ATR (D) is at 70% at close. This suggests that there is a potential (coverage) move of 30% in Pre/Post market as suggested by averages.
Custom Volume Session Example:
Set indicator to 30 period average. Set custom time frame to 9:30am to 10:30am Eastern/New York.
When the time frame for the calculation is closed, the indicator will provide a comparison of the current days volume compared to the average of 30 previous days for that same time frame and display it as a percentage in the table.
In this example you could compare how the first hour of the trading day compares to the previous 30 day's average, aiding in evaluating the potential volume for the remainder of the day.
Notes:
Times must be entered in 24 hour format. (1pm = 13:00 etc.)
Volume indicator is for Intra-day time frames, not > Day.
How I use these values:
I use these calculations to determine if a ticker symbol has the necessary range to achieve target gains, to determine if the price oscillation is within "normal" ranges to determine if the trading day will be choppy, and to determine placement of stops and targets within average ranges in combination with support, resistance and retracement levels.
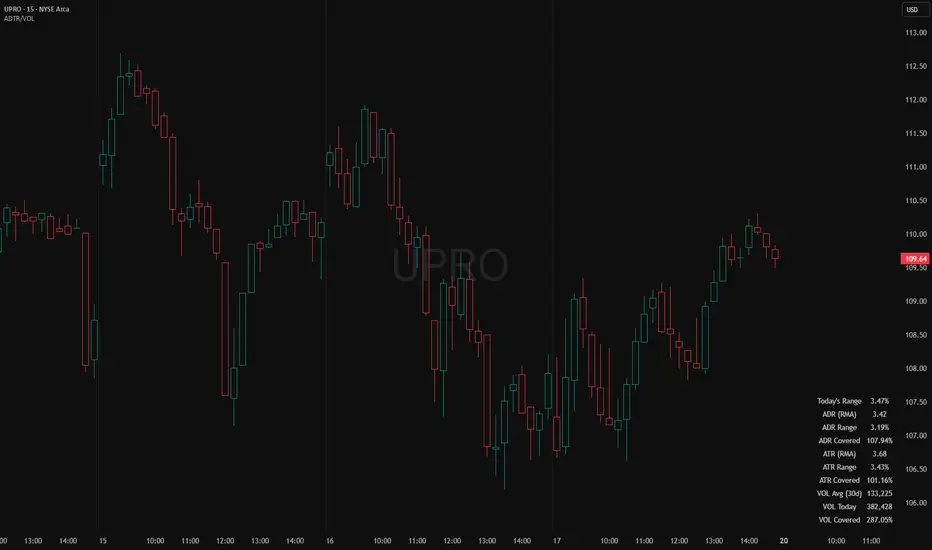
ADR & ATR OverlayADR & ATR Overlay
This indicator will display the following as an overlay on your chart:
ADR
% of ADR
ADR % of Price
ATR
% of ATR
ATR % of Price
Description:
ADR : Average Day Range
% of ADR : Percentage that the current price move has covered its average.
ADR % of Price : The percentage move implied by the average range.
ATR : Average True Range
% of ATR : Percentage that the current price move has covered its average.
ATR % of Price : The percentage move implied by the average true range.
Options:
Time Frame
Length
Smoothing
Enable or Disable each value
Text Color
Background Color
How to use this indicator:
The ADR and ATR can be used to provide information about average price moves to help set targets, stop losses, entries and exits based on the potential average moves.
Example: If the "% of ADR" is reading 100%, then 100% of the asset's average price range has been covered, suggesting that an additional move beyond the range has a lower probability.
Example: "ADR % of Price" provides potential price movement in percentage which can be used to asses R/R for asset.
Example: ADR (D) reading is 100% at market close but ATR (D) is at 70% at close. This suggests that there is a potential move of 30% in Pre/Post market as suggested by averages.
Notes:
These indicators are available as oscillators to place under your chart through trading view but this indicator will place them on the chart in numerical only format.
Please feel free to modify this script if you like but please acknowledge me, I am only a hobby coder so this takes some time & effort.
