POC Migration Velocity (POC-MV) [PhenLabs]📊POC Migration Velocity (POC-MV)
Version: PineScript™v6
📌Description
The POC Migration Velocity indicator revolutionizes market structure analysis by tracking the movement, speed, and acceleration of Point of Control (POC) levels in real-time. This tool combines sophisticated volume distribution estimation with velocity calculations to reveal hidden market dynamics that conventional indicators miss.
POC-MV provides traders with unprecedented insight into volume-based price movement patterns, enabling the early identification of continuation and exhaustion signals before they become apparent to the broader market. By measuring how quickly and consistently the POC migrates across price levels, traders gain early warning signals for significant market shifts and can position themselves advantageously.
The indicator employs advanced algorithms to estimate intra-bar volume distribution without requiring lower timeframe data, making it accessible across all chart timeframes while maintaining sophisticated analytical capabilities.
🚀Points of Innovation
Micro-POC calculation using advanced OHLC-based volume distribution estimation
Real-time velocity and acceleration tracking normalized by ATR for cross-market consistency
Persistence scoring system that quantifies directional consistency over multiple periods
Multi-signal detection combining continuation patterns, exhaustion signals, and gap alerts
Dynamic color-coded visualization system with intensity-based feedback
Comprehensive customization options for resolution, periods, and thresholds
🔧Core Components
POC Calculation Engine: Estimates volume distribution within each bar using configurable price bands and sophisticated weighting algorithms
Velocity Measurement System: Tracks the rate of POC movement over customizable lookback periods with ATR normalization
Acceleration Calculator: Measures the rate of change of velocity to identify momentum shifts in POC migration
Persistence Analyzer: Quantifies how consistently POC moves in the same direction using exponential weighting
Signal Detection Framework: Combines trend analysis, velocity thresholds, and persistence requirements for signal generation
Visual Rendering System: Provides dynamic color-coded lines and heat ribbons based on velocity and price-POC relationships
🔥Key Features
Real-time POC calculation with 10-100 configurable price bands for optimal precision
Velocity tracking with customizable lookback periods from 5 to 50 bars
Acceleration measurement for detecting momentum changes in POC movement
Persistence scoring to validate signal strength and filter false signals
Dynamic visual feedback with blue/orange color scheme indicating bullish/bearish conditions
Comprehensive alert system for continuation patterns, exhaustion signals, and POC gaps
Adjustable information table displaying real-time metrics and current signals
Heat ribbon visualization showing price-POC relationship intensity
Multiple threshold settings for customizing signal sensitivity
Export capability for use with separate panel indicators
🎨Visualization
POC Connecting Lines: Color-coded lines showing POC levels with intensity based on velocity magnitude
Heat Ribbon: Dynamic colored ribbon around price showing POC-price basis intensity
Signal Markers: Clear exhaustion top/bottom signals with labeled shapes
Information Table: Real-time display of POC value, velocity, acceleration, basis, persistence, and current signal status
Color Gradients: Blue gradients for bullish conditions, orange gradients for bearish conditions
📖Usage Guidelines
POC Calculation Settings
POC Resolution (Price Bands): Default 20, Range 10-100. Controls the number of price bands used to estimate volume distribution within each bar
Volume Weight Factor: Default 0.7, Range 0.1-1.0. Adjusts the influence of volume in POC calculation
POC Smoothing: Default 3, Range 1-10. EMA smoothing period applied to the calculated POC to reduce noise
Velocity Settings
Velocity Lookback Period: Default 14, Range 5-50. Number of bars used to calculate POC velocity
Acceleration Period: Default 7, Range 3-20. Period for calculating POC acceleration
Velocity Significance Threshold: Default 0.5, Range 0.1-2.0. Minimum normalized velocity for continuation signals
Persistence Settings
Persistence Lookback: Default 5, Range 3-20. Number of bars examined for persistence score calculation
Persistence Threshold: Default 0.7, Range 0.5-1.0. Minimum persistence score required for continuation signals
Visual Settings
Show POC Connecting Lines: Toggle display of colored lines connecting POC levels
Show Heat Ribbon: Toggle display of colored ribbon showing POC-price relationship
Ribbon Transparency: Default 70, Range 0-100. Controls transparency level of heat ribbon
Alert Settings
Enable Continuation Alerts: Toggle alerts for continuation pattern detection
Enable Exhaustion Alerts: Toggle alerts for exhaustion pattern detection
Enable POC Gap Alerts: Toggle alerts for significant POC gaps
Gap Threshold: Default 2.0 ATR, Range 0.5-5.0. Minimum gap size to trigger alerts
✅Best Use Cases
Identifying trend continuation opportunities when POC velocity aligns with price direction
Spotting potential reversal points through exhaustion pattern detection
Confirming breakout validity by monitoring POC gap behavior
Adding volume-based context to traditional technical analysis
Managing position sizing based on POC-price basis strength
⚠️Limitations
POC calculations are estimations based on OHLC data, not true tick-by-tick volume distribution
Effectiveness may vary in low-volume or highly volatile market conditions
Requires complementary analysis tools for complete trading decisions
Signal frequency may be lower in ranging markets compared to trending conditions
Performance optimization needed for very short timeframes below 1-minute
💡What Makes This Unique
Advanced Estimation Algorithm: Sophisticated method for calculating POC without requiring lower timeframe data
Velocity-Based Analysis: Focus on POC movement dynamics rather than static levels
Comprehensive Signal Framework: Integration of continuation, exhaustion, and gap detection in one indicator
Dynamic Visual Feedback: Intensity-based color coding that adapts to market conditions
Persistence Validation: Unique scoring system to filter signals based on directional consistency
🔬How It Works
Volume Distribution Estimation:
Divides each bar into configurable price bands for volume analysis
Applies sophisticated weighting based on OHLC relationships and proximity to close
Identifies the price level with maximum estimated volume as the POC
Velocity and Acceleration Calculation:
Measures POC rate of change over specified lookback periods
Normalizes values using ATR for consistent cross-market performance
Calculates acceleration as the rate of change of velocity
Signal Generation Process:
Combines trend direction analysis using EMA crossovers
Applies velocity and persistence thresholds to filter signals
Generates continuation, exhaustion, and gap alerts based on specific criteria
💡Note:
This indicator provides estimated POC calculations based on available OHLC data and should be used in conjunction with other analysis methods. The velocity-based approach offers unique insights into market structure dynamics but requires proper risk management and complementary analysis for optimal trading decisions.
Advanced

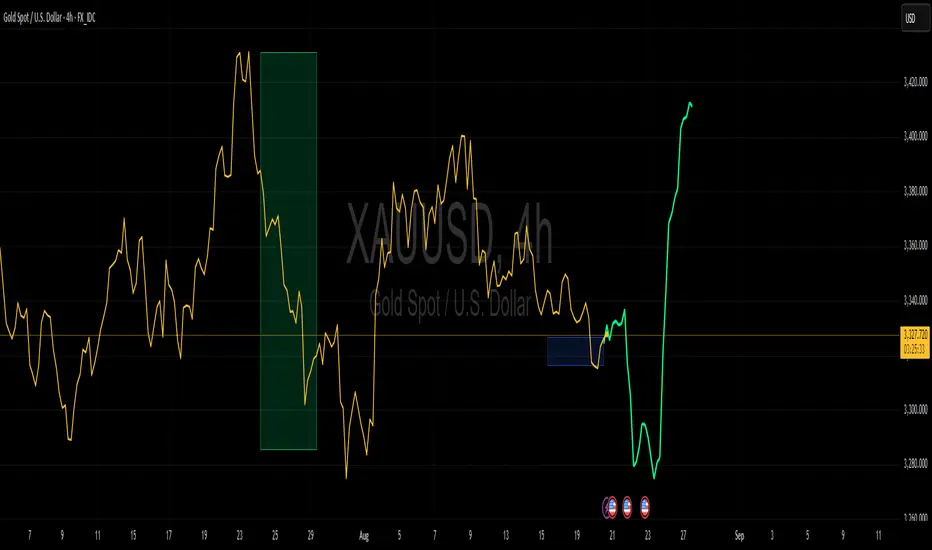
ADVANCED COSINE PROJECTION SYSTEM — LITE Mark3ACPS-Lite is a projection-based tool designed to visualize potential price paths using cosine-based similarity and stability analysis.
so, i have been working over multiple iterations to have a stable projection based on cosine principles and I've settled with a few stable algorithmic frameworks which works as: what i like to call : next generation leading indicators.
This indicator works well with any charting type like line/bar/candles etc. across ALL timeframes. (including seconds).
Basically this indicator projects a path towards the right.
Based on the trend the color of the projection updates on live refresh (depends on your timeframe of choice)
GREEN path projection for possible up trend
RED for bearish and yellow for sideways trend.
Technical : This indicator Aims to solve "DIRECTION" .
The idea was to to calculate angle between any given vectors : so if we translate it into the trading world : we are trying to determine direction (simplified explanation).
Pros : Scale Independent
meaning factors like flash crash , High impact movements (like NFP's) dont impact the projection logic in terms of Magnitude.
My model focuses on pattern similarity
example : in the previous instance of similar situation how did price react ?
therefore making a similar "COSINE" projection. (based on past "vector"/event)
on the left side there will always be an highlighted box section to visually represent where the future projections are based off of.
Cons: multiple vectors can have same direction from the cosine logic : essentially rendering the projected distance inconclusive.
but i solved that problem fully but on this lite version i made use of live refresh feature to keep the projections on a float : making our right side projections that much more fluid.
finally as a psychological factor not to get caught up on any Bias i made sure the indicator switches color according to immediate trend change logi.
Best Use case : have this indicator across multiple timeframes inside Tradingvieews tabs to Help make better Judgement.
I'm open for feedback / suggestions.
regards,
drsamc.
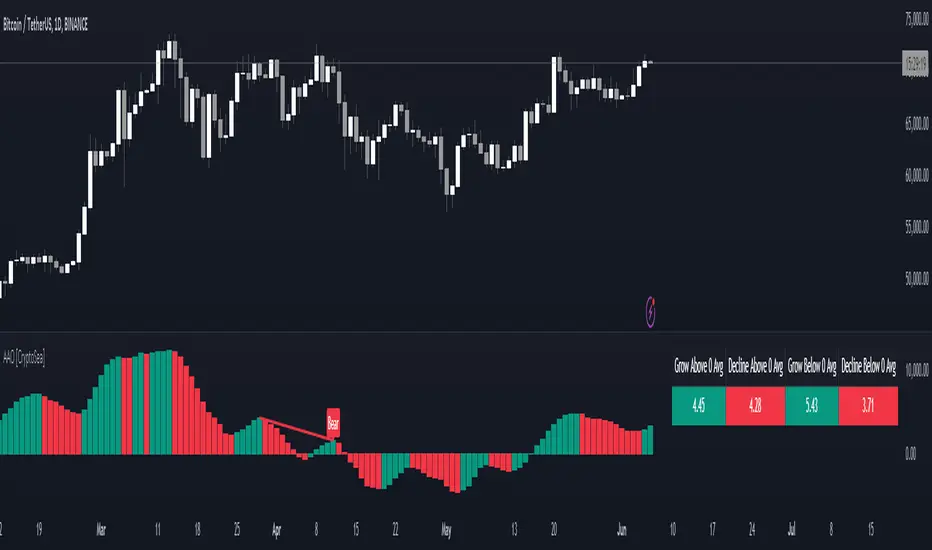
Advanced Awesome Oscillator [CryptoSea]Advanced AO Analysis Indicator
The Advanced AO Analysis indicator is a sophisticated tool designed to evaluate the Awesome Oscillator (AO) in search of regular and hidden divergences that signal potential price reversals. By tracking the intensity and duration of the AO's movements, this indicator aids traders in pinpointing critical points in price action.
Key Features
Divergence Detection: Identifies both regular and hidden bullish and bearish divergences, providing early signs of potential market reversals.
Customizable Lookback Periods: Allows users to set specific lookback windows to define the strength and relevance of detected divergences.
Adaptive Oscillator Display: Features customizable display options for the AO, enabling users to view data in different modes suited to their analysis needs.
Alert System: Includes configurable alerts to notify users of potential divergence formations, helping traders respond promptly.
How it Works
AO Calculation: Computes the AO as the difference between short-term and long-term moving averages of the midpoints of bars, highlighting momentum shifts.
Pivot Point Analysis: Utilizes advanced algorithms to find low and high pivot points based on the oscillator values, crucial for spotting trend reversals.
Range Validation: Verifies that divergences occur within a predefined range from pivot points, ensuring their validity and strength.
Visualisation: Plots AO values and potential divergences directly on the chart, aiding in quick visual analysis.
Application
Strategic Decision-Making: Assists traders in making informed decisions by providing detailed analysis of AO movements and divergence.
Trend Confirmation: Reinforces trading strategies by confirming potential reversals with pivot point detection and divergence analysis.
Behavioural Insight: Offers insights into market dynamics and sentiment by analyzing the depth and duration of AO cycles above and below zero.
The Advanced AO Analysis indicator equips traders with a powerful analytical tool for studying the Awesome Oscillator in-depth, enhancing their ability to spot and act on divergence-based trading opportunities in the cryptocurrency markets.
Advanced Stochastic [CryptoSea]The Advanced Stochastic Indicator is a sophisticated tool designed to enhance market analysis through detailed stochastic calculations. This tool is built for traders who seek to identify market divergences and pivot points with higher accuracy.
Key Features
Multi-Layer Stochastic Analysis: Tracks both standard and smoothed stochastic values to provide a granular view of market momentum.
Divergence Detection: Automatically detects both regular and hidden bullish and bearish divergences, offering critical insights into potential market reversals.
Adaptive Oscillator Display: Features customizable display options for the stochastic oscillator, allowing traders to view data in Default, Histogram, or Both modes.
Customizable Lookback Periods: Users can set specific lookback periods for divergence analysis and stochastic calculations, tailoring the tool to fit various trading strategies.
In the example below, there is a bearish divergence above 0. You would first want the stoch to break below the 0 level as a show of strength, this would be an aggressive entry, a higher probability option would be to wait for the stoch to retest and reject from 0 which is what we have a few candles later.
How it Works
Stochastic Calculation: Computes the stochastic oscillator by smoothing the %K line over a user-defined period, then applying a second smoothing for the %D line.
Pivot Point Analysis: Utilizes advanced algorithms to find low and high pivot points based on the oscillator values, crucial for spotting trend reversals.
Colour-Coded Divergence Alerts: Utilizes color codes to highlight divergence signals directly on the chart, aiding in quick visual analysis.
Responsive Threshold Settings: Includes options to adjust the sensitivity of divergence detection, ensuring that only significant divergences are highlighted.
In the example below, we have 2 divergence signals. The first a bullish one which fails to break above 0. The second signal is given above 0 so you would want a retest and a show of strength when the stoch returns to 0 but it fails to hold. Both of these divergence signals are invalidated.
Application
Strategic Decision-Making: Assists traders in making informed decisions by providing detailed analysis of stochastic movements and divergence.
Trend Confirmation: Reinforces trading strategies by confirming potential reversals with pivot point detection and divergence analysis.
Customized Analysis: Adapts to various trading styles with extensive input settings that control the display and sensitivity of oscillator data.
The Advanced Stochastic Indicator by is an invaluable addition to a trader's toolkit, offering depth and precision in market trend analysis to navigate complex market conditions effectively.

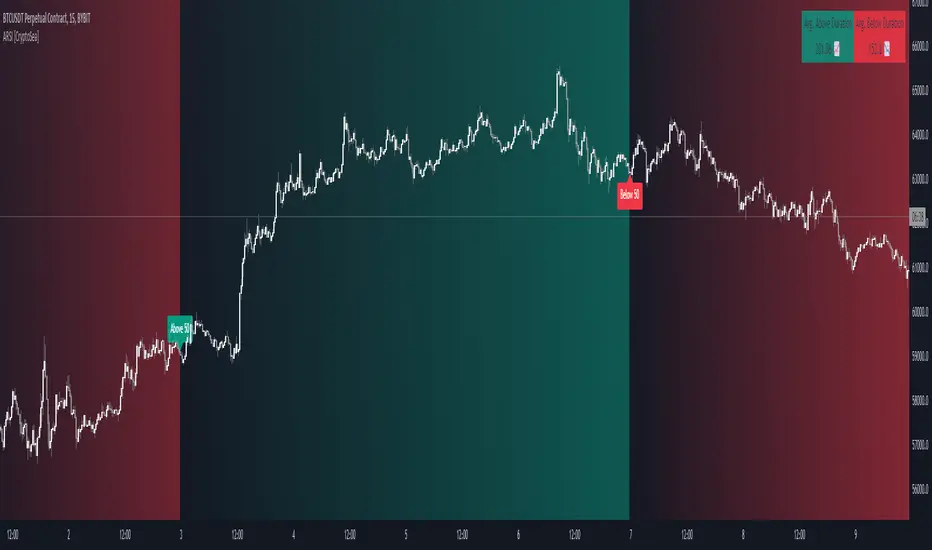
Advanced RSI [CryptoSea]The Advanced RSI Duration (ARSI) is a unique tool crafted to deepen your market insights by focusing on the duration the Relative Strength Index (RSI) spends above or below key thresholds. This innovative approach is designed to help traders anticipate potential market reversals by observing sustained overbought and oversold conditions.
Core Feature
Duration Monitoring ARSI's standout feature is its ability to track how long the RSI remains in overbought (>70) or oversold (<30) conditions. By quantifying these durations, traders can gauge the strength of current market trends and the likelihood of reversals.
Enhanced Functionality
Multi-Timeframe Flexibility : Analyze the RSI duration from any selected timeframe on your current chart, offering a layered view of market dynamics.
Customizable Alerts : Receive notifications when the RSI maintains its position above or below set levels for an extended period, signaling sustained market pressure.
Visual Customization : Adjust the visual elements, including colors for overbought and oversold durations, to match your analytical style and preferences.
Label Management : Control the frequency of labels marking RSI threshold crossings, ensuring clarity and focus on significant market events.
Settings Overview
RSI Timeframe & Length : Tailor the RSI calculation to fit your analysis, choosing from various timeframes and period lengths.
Threshold Levels : Define what you consider overbought and oversold conditions with customizable upper and lower RSI levels.
Duration Alert Threshold : Set a specific bar count for how long the RSI should remain beyond these thresholds to trigger an alert.
Visualization Options : Choose distinct colors for durations above and below thresholds, and adjust label visibility to suit your charting approach.
Application & Strategy
Use ARSI to identify potential turning points in the market
Trend Exhaustion : Extended periods in overbought or oversold territories may indicate a strong trend but also warn of possible exhaustion and impending reversals.
Comparative Analysis : By evaluating the current duration against historical averages, traders can assess the relative strength of ongoing market conditions.
Strategic Entries/Exits : Utilize duration insights to refine entry and exit points, capitalizing on the predictive nature of prolonged RSI levels.
Alert Conditions
The Advanced RSI (ARSI) offers critical alert mechanisms to aid traders in identifying prolonged market conditions that could lead to actionable trading opportunities. These conditions are designed to alert traders when the RSI remains at extremes longer than typical durations, signaling sustained market behaviors.
Above Upper Level Alert: This alert is triggered when the RSI sustains above the upper threshold (usually 70) for more than the configured duration, indicating strong bullish momentum or potential overbought conditions.
Below Lower Level Alert: Similarly, this alert is activated when the RSI stays below the lower threshold (commonly 30) for an extended period, suggesting significant bearish momentum or potential oversold conditions.
These alerts enable traders to respond swiftly to extend market conditions, enhancing their strategy by providing timely insights into potential trend reversals or continuations.
The Advanced RSI Duration Analysis empowers traders with a nuanced understanding of market states, beyond mere RSI values. It highlights the significance of how long markets remain in extreme conditions, offering a predictive edge in anticipating reversals. Whether you're strategizing entries or preparing for shifts in market momentum, ARSI is your companion for informed trading decisions.
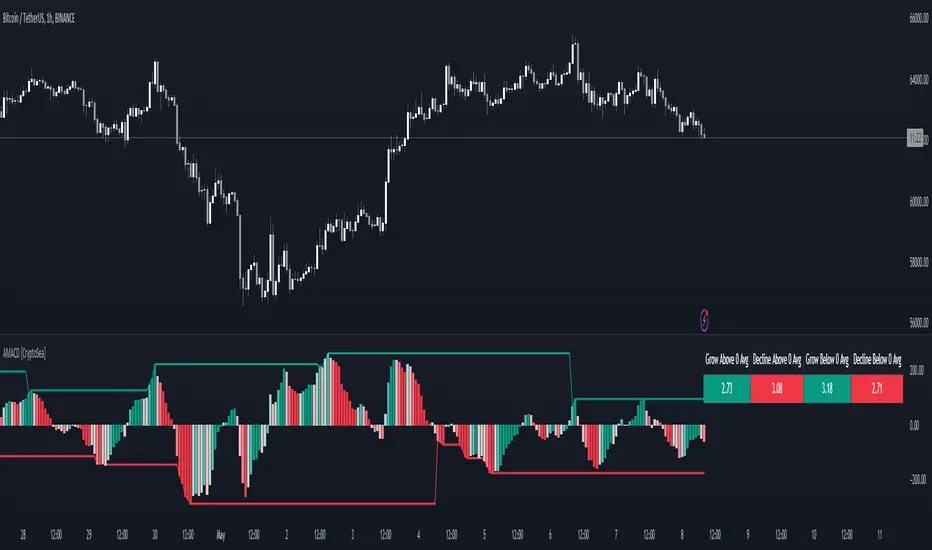
Advanced MACD [CryptoSea]Advanced MACD (AMACD) enhances the traditional MACD indicator, integrating innovative features for traders aiming for deeper insights into market momentum and sentiment. It's crafted for those seeking to explore nuanced behaviors of the MACD histogram, thus offering a refined perspective on market dynamics.
Divergence moves can offer insight into continuation or potential reversals in structure, the example below is a clear continuation signal.
Key Features
Enhanced Histogram Analysis: Precisely tracks movements of the MACD histogram, identifying growth or decline periods, essential for understanding market momentum.
High/Low Markers: Marks the highest and lowest points of the histogram within a user-defined period, signaling potential shifts in the market.
Dynamic Averages Calculation: Computes average durations of histogram phases, providing a benchmark against historical performance.
Color-Coded Histogram: Dynamically adjusts the histogram's color intensity based on the current streak's duration relative to its average, offering a visual cue of momentum strength.
Customisable MACD Settings: Enables adjustments to MACD parameters, aligning with individual trading strategies.
Interactive Dashboard: Showcases an on-chart table with average durations for each phase, aiding swift decision-making.
Settings & Customisation
MACD Settings: Customise fast length, slow length, and signal smoothing to tailor the MACD calculations to your trading needs.
Reset Period: Determine the number of bars to identify the histogram's significant high and low points.
Histogram High/Lows: Option to display critical high and low levels of the histogram for easy referencing.
Candle Colours: Select between neutral or traditional candle colors to match your analytical preferences.
When in strong trends, you can use the average table to determine when to look to get into a position. This example we are in a strong downtrend, we then see the histogram growing above the average in these conditions which is where we should look to get into a shorting position.
Strategic Applications
The AMACD serves not just as an indicator but as a comprehensive analytical tool for spotting market trends, momentum shifts, and potential reversal points. It's particularly useful for traders to:
Spot Momentum Changes Utilise dynamic coloring and streak tracking to alert shifts in momentum, helping anticipate market movements.
Identify Market Extremes Use high and low markers to spot potential market turning points, aiding in risk management and decision-making.
Alert Conditions
Above Average Movement Alerts: Triggered when the duration of the MACD histogram's growth or decline is unusually long, these alerts signal sustained momentum:
Above Zero: Alerts for both growing and declining movements above zero, indicating either continued bullish trends or potential bearish reversals.
Below Zero: Alerts for growth and decline below zero, pointing to potential bullish reversals or confirmed bearish trends.
High/Low Break Alerts: Activated when the histogram reaches new highs or falls to new lows beyond the set thresholds, these alerts are crucial for identifying shifts in market dynamics:
Break Above Last High: Indicates a potential upward trend as the histogram surpasses recent highs.
Break Below Last Low: Warns of a possible downward trend as the histogram drops below recent lows.
These alert conditions enable traders to automate part of their market monitoring or potential to automate the signals to take action elsewhere.
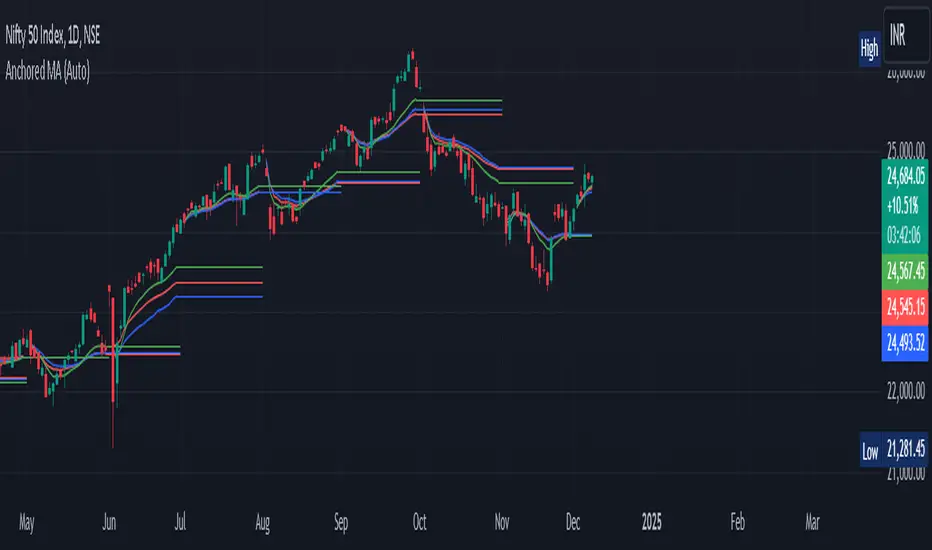
Anchored Moving Average By Market Mindset - Zero To EndlessAnchored Moving Average?
An anchored moving average (AMA) is created when you select a point on the chart and start calculating the moving average from there. Thus the moving average’s denominator is not fixed but cumulative and dynamic.
In this indicator, I've provided three different types of Anchored Moving Averages, viz., WMA, SMA and VWAP.
WMA is relevant if big moves are there.
SMA is relevant if volume data is not to be considered or if it is not available.
VWAP is the standard anchored MA, which is most commontly used. Is consider the volume data along with the price move.
In this indicator, Auto anchor is time based anchor. A trader can opt for Pivot Type Anchor or Volume Type Anchor or some higher resolution based anchor too. The length of the pivot lookback can also be changed by the user.
It can be used for intraday, swing trading and even for technical based investment purpose.
ATR+ Advanced Sessions ATR for DaterangeATR+ Advanced Sessions ATR for Daterange
The ATR+ adds the following additional filters to the stock ATR indicator by Tradingview:
- Calculates the overall average ATR for a user defined daterange, optionally filtered by trading session and selected weekdays, presented as a secondary line over the standard ATR line.
- Basic ATR line, with colour highlight to indicate the selected sessions, days and timeframe being calculated by the average ATR+ line.
- Average ATR+ line indicating the average of all ATRs within the defined timeframe, optionally filtered by instances of a selected trading session and selected weekdays.
- Customisable appearance.
- The ATR+ also includes the basic ATR configuration options typically found in the standard ATR by Tradingview, including period length and smoothing type. Defaults are set to the factory standards: 14 length, RMA smoothing type.
What Is the Average True Range (ATR)?
The ATR is a technical analysis tool that measures market volatility by decomposing the entire range asset price for that period. Investopedia describes the ATR as follows:
"The average true range (ATR) is a technical analysis indicator, introduced by market technician J. Welles Wilder Jr. in his book New Concepts in Technical Trading Systems, that measures market volatility by decomposing the entire range of an asset price for that period.
The true range indicator is taken as the greatest of the following: current high less the current low; the absolute value of the current high less the previous close; and the absolute value of the current low less the previous close. The ATR is then a moving average, generally using 14 days, of the true ranges."
For more information on the ATR and its calculations and use cases, see here:
Investopedia link here.
Tradingview link here.
Note
The indicator may time out if the number of bars being calculated is too long. If this happens, you will need to reduce the datetime range, or increase the chart timeframe in order to reduce the number of bars being calculated and the indicator will attempt to recalculate.

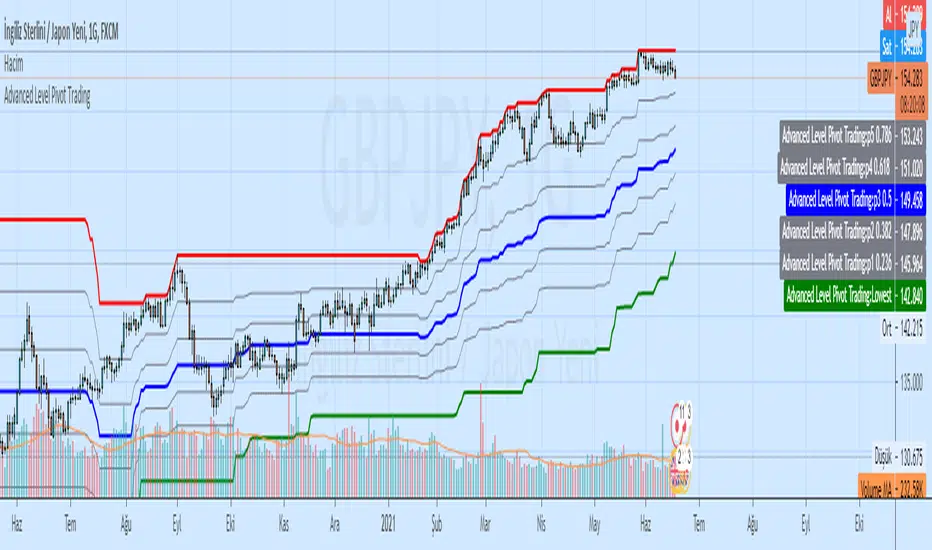
Advanced Level Pivot TradingAdvanced Level Pivot Trading
Highest Lowest Channel and Level Pivot (Fibonacci)
Multi-TF Avg BBandsMULTI-TF AVERAGE BBANDS - with signals (BETA)
Overall, it shows where the price has support and resistance, when it's breaking through, and when its relatively low/high based on the magic of standard deviation.
created by gamazama. send me a shout if u find this useful, or if you create something cool with it.
%BB: The price's position in the boilinger band is converted to a range from 0-1. The midpoint is at 0.5
Description of parameters
"BB:Window Length" is the standard BB size of 20 candles.
The indicator plots up to 7 different %BB's on different timescales
They are calculated independently of the timescale you are viewing eg 12h, 3d, 30m will be the same output
You can enter 7 timescales, eg. if you want to plot a range of bbands of the 12h up to 3d graphs, enter values between 0.5 and 3 (days) - you can also select 0 to disable and use less timescales, or select hours or minutes
Take note if you eg. double the main multiplier to 40, it is the same as doubling all your timescales
You can turn the transparency of the 7 x %BB's to 100 to hide them, their average is plotted as a thick cyan line
"Variance" is a measure of how much the 7 BB's agree, and changes colour based on the thresholds used for the strategy
---- TO START FROM SCRATCH ----
- set all except one to ZERO (0), set to 0, and everything after to 0.
Turn ON and right click -> move the indicator to a new pane - this will show you the internal workings of the indicator.
Then there is a few standard settings
"Source Smoothing Amount" applies a basic small sma on the price.
It should be turned down when viewing candles with less information, like 1D or more.
Standard BBands use an SMA, there one uses a blend between VWMA or SMA
Volume Weight settings, the same as SMA at 0, and the same as VWMA at 1
BB^2 is a bband drawn around the average %BB. Adjust the to change its window length
The BB^2 changes color when price moves up or down
Now its time to look at the parameters which affect the buy/sell signals
turn on "show signal range" - you see some red lines
buy and sell each have 4 settings
min/max variance will affect the brigtness of the signal range
range adjust will move the range up/down
mix BB^2 blends between a straight line (0) and BB^2's top or bottom (1)
a threshold of "variance" and "h/l points" is available to generate weaker signals.
these thresholds can be increased to show more weak signals
ONCE YOU ARE HAPPY WITH THE SIGNALS being generated, you can turn OFF , and move it back to the price pane
the indicator then draws a bband around the price to maps some info into the chart:
fills a colour between 0.5 & the mid BB^2 and converts relative to the price chart
draws a line in the middle of the midband.
controls how much these lines diverge from the price - adjust it to reduce noise
converts the signal range (red lines) to be relative to the price chart
if you like, you can adjust the sell & buy signals in the tab from and to and to match the picture. It messes with auto-scaling when moving back to though
enjoy, I hope that is easy enough to understand, still trying to make this more user-friendly.
If you want to send me some token of appreciation - btc: 33c2oiCW8Fnsy41Y8z2jAPzY8trnqr5cFu
I promise it will put a fat smile on my face

Chande Momentum OscillatorChande Momentum Oscillator script.
This indicator was developed and described by Tushar S. Chande and Stanley Kroll in their book "The New Technical Trader" (1994, Chapter 5: New Momentum Oscillators).

Advance-Decline Volume Percent Backtest Advance-Decline Volume Percent (AD Volume Percent) is a breadth indicator
that measures the percentage of Net Advancing Volume for a particular group
of stocks, such as an index or ETF. Net Advancing Volume equals the volume
of advances less the volume of declines. AD Volume Percent equals Net Advancing
Volume divided by total volume for the group. AD Volume Percent fluctuates
between -100% and +100%.
You can change long to short in the Input Settings
Please, use it only for learning or paper trading. Do not for real trading
