ADX +- DiThis Adx +-Di is just a complete version of what the ADX is supposed to signal.
So you have:
15 (contraction), 20 (threshold), 30 (expansion), 40 (resistance) levels.
Below 20 the price is not trending
Above 30 the price is trending
Below 15 price has been in contraction for too long
Between 20 and 30 price is in a "transition zone".
I finally added a "Resistance" level (40), which has to be adapted to best represent the historical levels where price usually encounters resistance, and where the price can be declared "overtrending", which means a return to lower levels is likely to happen.
I've chosen mild colors, and set the Adx Color to White, because I use black background, you can easily change that.
Enjoy
-Maurice
ADX


[ALERTS] ADX and DIThe average directional index (ADX) is a technical analysis metric. Analysts use it to determine the relative strength of a trend, with the direction of the trend either upwards or downwards.
The Average Directional Index (ADX) along with the Negative Directional Indicator (-DI) and the Positive Directional Indicator (+DI) are momentum strength indicators that evolved for use in stock trading. Commodities trader J. Welles Wilder pioneered their use. Technical traders who use charting techniques want to know when first spotting a shifting trend how strong that trend is and how likely it is to sustain itself over time. The ADX helps investors determine trend strength as they plan their investment strategies.
Confirmation on a chart and other momentum indicators help investors spot trend reversals. But some trends are more potent than others and investors want to better understand the strength of a trend. The ADX identifies a strong positive trend when the ADX is over 25 and a weak trend when the ADX is below 20. Investors can determine directional movement by analyzing the difference between two consecutive low prices and their correlated highs. The movement is +DM when the current high price, less the previous high price, is greater than the previous low price less the current low. The opposite applies in determining the negative or –DI.
When analyzing charts, stock price is the single most important variable to follow. ADX and other indicators are supplementary to price movements in providing additional directional information and support. For example, some of the best trends come about from price range consolidation. It is those tugs of war between buying and selling volumes that lead to breakouts and other trading opportunities.
The Inventor of the Average Directional Index
J. Welles Wilder, Jr. is a former American engineer and real estate developer who went on to revolutionize trading analysis by applying mathematical systems to the world of investing. In addition to developing the ADX, Wilder is also responsible for several other commonly used technical analysis tools including the Average True Range (ATR), the Relative Strength Index (RSI) and the Parabolic SAR.
www.investopedia.com
This script has alerts and includes the filter for markets with no trend defined.
Green Alert --> Long
Red Alert --> Short
Yellow Area --> Weak trend. ADX below threshold
Green candles --> Bullish Market
Red Candles --> Bearish Market
Orange candles --> No defined trend
Enjoy!


Average Directional Index-BuschiA simple modification of the built-in "Average Directional Index":
To identify wether there is an uptrend or a downtrend, the function color is conditional:
no trend: black
small uptrend (weak threshold): light green
big uptrend (strong threshold): green
small downtrend (weak threshold): light red
big downtrend (strong threshold): red

Average Directional Movement Index Rating ADXR by KIVANÇ fr3762Average Directional Movement Rating quantifies momentum change in the ADX . It is calculated by adding two values of ADX (the current value and a value n periods back), then dividing by two. This additional smoothing makes the ADXR slightly less responsive than ADX . The interpretation is the same as the ADX ; the higher the value, the stronger the trend.
The ADXR , being a smoothed version of ADX , and can be used similarly to the ADX in the three rule system discussed on the ADX section..
The ADXR is a measure of the spread between the Directional Indicators ( +DI and -DI ). When the ADXR is declining, it's not advised to use a trend following system. However, a rising ADXR signals that the dominant trend is likely to continue. A rising ADXR , with both the ADXR and DI+ above the D- indicates a strengthening bullish market. The scan syntax needed to represent this condition would be...
ADXR > DIMINUS AND DIPLUS > DIMINUS AND ADXR > ADXR .1
A rising ADXR , with both the ADXR and DI- above DI+ indicates a strengthening bearish trend . The scan syntax needed to represent this condition would be...
ADXR > DIPLUS AND DIMINUS > DIPLUS AND ADXR > ADXR .1
If the ADXR has been below both DI+ and DI- but has begun to rise a new market trend is emerging. The scan syntax needed to represent this condition would be...
ADXR < DIPLUS AND ADXR < DIMINUS AND ADXR > ADXR .1
IMPORTANT NOTICE: USERS CAN ADD ADX DI+ and DI- indicators by checking the box in the settings of the indicator.
Developed by J.Welles Wilder
ÖNEMLİ BİLGİ: KULLANICILAR ADX , DI- ve DI+ indikatörlerini de ayarlar bölümündeki kutucukları işaretleyerek sayfaya ekleyebilirler.

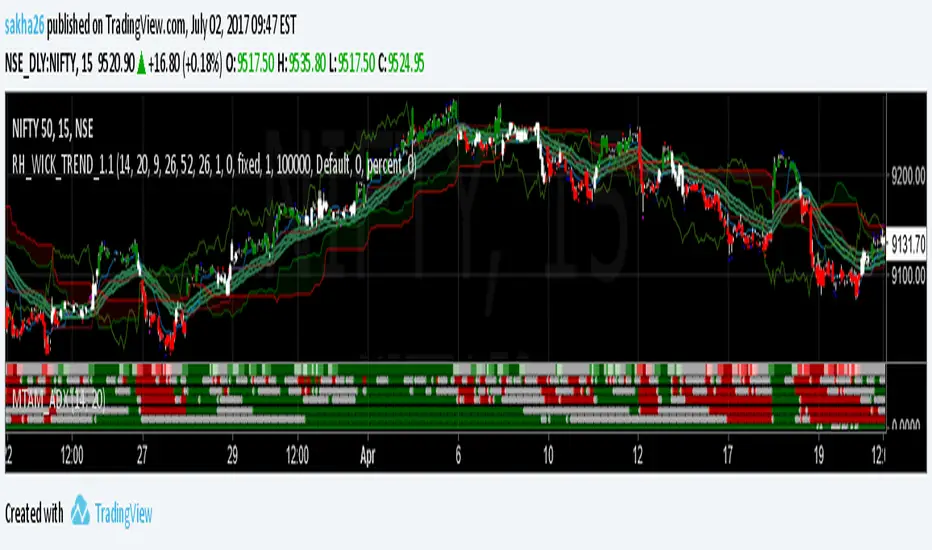
DMI ADX TREND 2.0 (edit by GeertVD)Edit of the popular script by @TraderR0BERT
New features:
- horizontal colored areas, indication weak/medium/strong trend
- vertical bars, signaling trend/momentum changes
- DI+ vs DI- contraction/expansion histogram (to measure the DI volatility)

ADX Overlap with MACD FilterIt’s a method/study to find trending stocks and cryptocurrencies using two different periods (14, 5) ADX Overlap with a MACD Filter. The MACD filter may or may not be used.
Green shadow implies Trending Uptrend
Red shadow implies Trending Downward
I am a disabled man. Therefore, I am not able to write in detail here today. More Details will follow as time permits. Please let me know if I am missing anything…
Legal Disclaimer: I am not bribed to write here and I am not seeking insider favors. I wrote here so I get replies from fellow viewers to educate myself and for my daily expenses. Hence, if anyone uses this post for making their decisions, I am not responsible for any failures incurred.
Safe Trading!
Kal Gandikota
PS: If you found this script interesting and edifying please follow and upvote.
PS2: Please kindly donate for my daily expenses (atleast as you would on streets) at the following addresses:
'BTC Wallet' - 1NeDC1GvpFa49DFLuT1v28ohFjqtoWXNQ5
ETH Wallet - 0x0450DCB7d4084c6cc6967584263cF6fBebA761D1
'BTS Wallet' - chip-maker
QTUM Wallet - QhqqV3WQV236Tz5ZbPceXXvU8aK2N4i78A
NEO Wallet - AUdiNJDW7boeUyYYNhX86p2T8eWwuELSGr
PS3: To open a cryptocurrency trading account at the brokerage where I trade most for now, please kindly use the following website(with referral code attached):
www.binance.com
PS4: For more information on ADX and MACD, please 'Google' or search here yourself.
Kal’s ADX Overlap with MACD FilterIt’s a method/study to find trending stocks/cryptocurrencies which uses two different periods (14, 5) ADX Overlap with a MACD Filter. The MACD filter may or may not be used.
More Details will follow as time permits. Please let me know if I am missing anything…..
Legal Disclaimer: I am not bribed to write here and I am not seeking insider favors. I wrote here so I get replies from fellow viewers to educate myself and for my daily expenses. Hence, if anyone uses this post for making their decisions, I am not responsible for any failures incurred.
Safe Trading!
Kal Gandikota
PS: If you found this script interesting and edifying please follow and upvote.
PS2: Please kindly donate for my daily expenses (atleast as you would on streets) at the following addresses:
'BTC Wallet' - 1NeDC1GvpFa49DFLuT1v28ohFjqtoWXNQ5
ETH Wallet - 0x0450DCB7d4084c6cc6967584263cF6fBebA761D1
'BTS Wallet' - chip-maker
QTUM Wallet - QhqqV3WQV236Tz5ZbPceXXvU8aK2N4i78A
NEO Wallet - AUdiNJDW7boeUyYYNhX86p2T8eWwuELSGr
PS3: To open a cryptocurrency trading account at the brokerage where I trade most for now, please kindly use the following website(with referral code attached):
www.binance.com
PS4: For more information on ADX and MACD, please 'Google' or search here on Tradingview

ADX coded with DIAn easier to read implementation of ADX and DI, with colour indicating direction of trend, oscillator indicating strength of trend, and below threshold shown with a lack of colour (black).

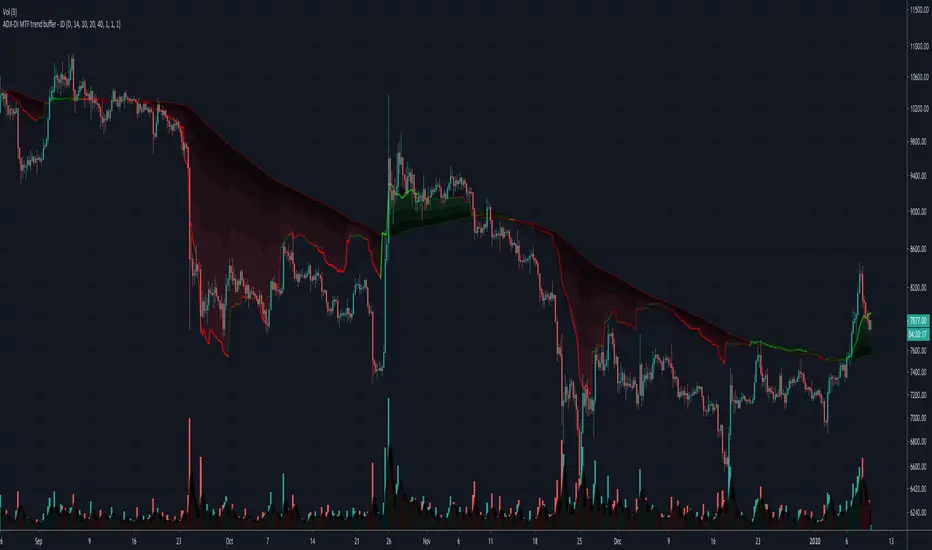
ADX-DI MTF trend buffer - JDThe indicator gives a multiplication of ADX and the DI+ and DI-values, color coded for bullish or bearish momentum
the indicator was optimised for use with HA-candles, but works with regular candles as well
and shows general market direction en divergence in a simpler visual way than the normal ADX-DI lines
a threshold mask can be shown or omitted as preferred
version 3. the indicator is now plotted relative to the 200 ema and can be seen as a "buffer" against price reversal
The timeframe of the indicator can be the current one or custom selected but gives better visual information if a longer timeframe than the current one is used.
The colors can be changed to fit with "Dark mode" or "Light mode"
a scaling option is available to downscale the trend indication relative to the price bars
JD
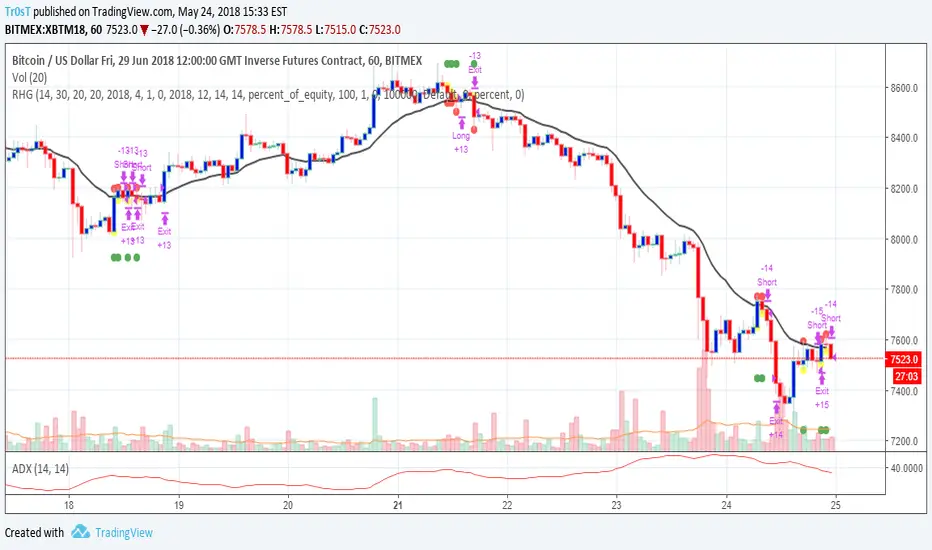
Linda Raschke's Holy GrailAnother script based on Linda Raschke's strategy with the same name from her book about swing trading.
Average Directional Index with DI SpreadThis indicator converts conventional triple lined ADX, DI+ and DI- into two lines. First line is the
original ADX line and second line is obtained by subtracting DI- from DI+ which named DI Spread(DIS)
If ADX is greater than 20 there is a trend and if greater than 40 there is a strong trend but ADX does not tell
the trend direction
To determine trend direction, DIS can be used with ADX; Sımply; If DIS is greater than 0, it is an uptrend and If DIS
is less than 0, it is a downtrend.
To sum up;
If ADX is greater than 20 and especially greater than 40 with positive DIS value, this implies an uptrend.
If ADX is greater than 20 and especially greater than 40 with negative DIS value, this implies a downtrend.
*Because of coloration and reference levels used, this indicator is really simple and efficient to analyze trend direction.

ADX-DI MTF trend indication - JD version 2Version 2 added support for MTF, to see the trend direction on the lower or higher timeframe.
As an example to see the difference, the indicator is added three times, one time for the current TF, one set at the higher and one at the lower TF.
Cudo's to Chris Moody for the MTF-switching-code!!
JD.

ADX-DI trend indication - JDThis indicator is based on the formulas in the original "ADX and DI" script of Masa Nakamuro
The indicator gives a multiplication of ADX and the DI+ and DI-values, color coded for bullish or bearish momentum.
The indicator was optimised for use with HA-candles, but works with regular candles as well and shows general market direction en divergence in a simpler visual way than the normal ADX-DI lines.
A threshold mask and the actual DI-lines kan be shown or omitted as preferred
JD.

ADX-DI trend indication - JDThis indicator is based on the formulas in the original "ADX and DI" script of Masa Nakamuro
The indicator gives a multiplication of ADX and the DI+ and DI- values, color coded for bullish or bearish momentum.
The indicator was optimised for use with HA-candles, but works with regular candles as well and shows general market direction en divergence in a simpler visual way than the normal ADX-DI lines.
A threshold mask and the actual DI-lines kan be shown or omitted as preferred
JD.

ADX and DI (Average Directional Index) - CORRECT FORMULASo... the popular version of "ADX and DI" shown on tradingview by masanakamura uses some wacky and incorrect formula for DI and uses SMA instead of the Wilder's MA that ADX/DI is supposed to use, and doesn't give the correct ADX and DI values. The Tradingview "Average Directional Index" uses the correct calculation but doesn't show DI+ and DI-. So, here it is with the DI+ and DI- visible. Enjoy!

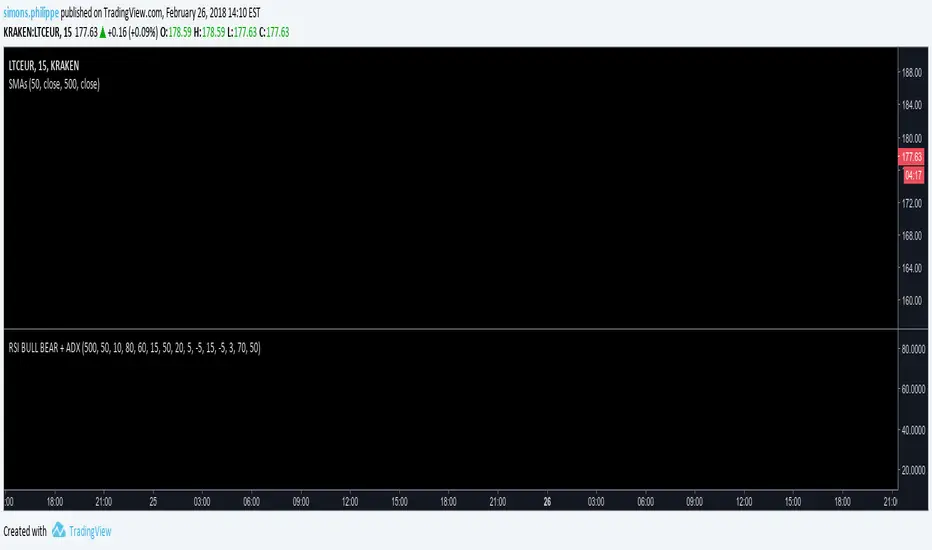
RSI BULL BEAR + ADXlong-signal when crossig the lower threshold
short-signal when crossing the upper threshold
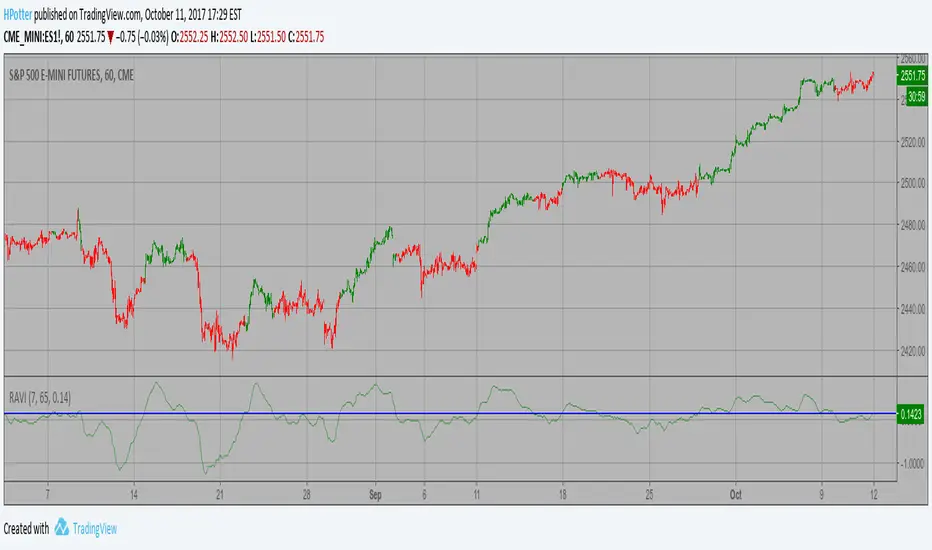
Range Action Verification Index (RAVI) Backtest The indicator represents the relative convergence/divergence of the moving
averages of the financial asset, increased a hundred times. It is based on
a different principle than the ADX. Chande suggests a 13-week SMA as the
basis for the indicator. It represents the quarterly (3 months = 65 working days)
sentiments of the market participants concerning prices. The short moving average
comprises 10% of the one and is rounded to seven.
You can change long to short in the Input Settings
WARNING:
- For purpose educate only
- This script to change bars colors.

Range Action Verification Index (RAVI) Strategy The indicator represents the relative convergence/divergence of the moving
averages of the financial asset, increased a hundred times. It is based on
a different principle than the ADX. Chande suggests a 13-week SMA as the
basis for the indicator. It represents the quarterly (3 months = 65 working days)
sentiments of the market participants concerning prices. The short moving average
comprises 10% of the one and is rounded to seven.
WARNING:
- This script to change bars colors.
ADX and RSI ComboThis indicator combines two separate Simple RSI indicators so you can show different periods together, as well as an ADX indicator with DI+ and DI-. I prefer to use one indicator to show the whole thing, instead of stacking the individual indicators.
[naoligo] Simple ADXI'm publishing this indicator just for study purposes, because the result is exactly the same as DMI without the smoothing factor. It is exactly the same as ADX Wilder from MT5.
I was looking for the algorithm all over and it was a pain to find the right formula, meaning: one that would match with the built-in ones. After several study and comparison, I still didn't find the algorithm that match with the MT5's built-in simple ADX ...
Enjoy!