ICT Macro Tracker - Study Version (Original by toodegrees)This indicator is a modified study version of the ICT Algorithmic Macro Tracker by toodegrees, based on the original open-source script available at The original indicator plots ICT Macro windows on the chart, corresponding to specific time [ periods when the Interbank Price Delivery Algorithm undergoes checks/instructions (aka "macros") for the price engine to reprice to an area of liquidity or inefficiency.
This study version adds functionality to hide bars outside macro periods. When enabled, the indicator draws boxes that cover the full chart height during non-macro periods, obscuring those bars so only macro periods are visible. This helps focus on macro-only price action. The feature is configurable, allowing users to enable or disable it and customize the box color. All original functionality remains intact.
Algorithm

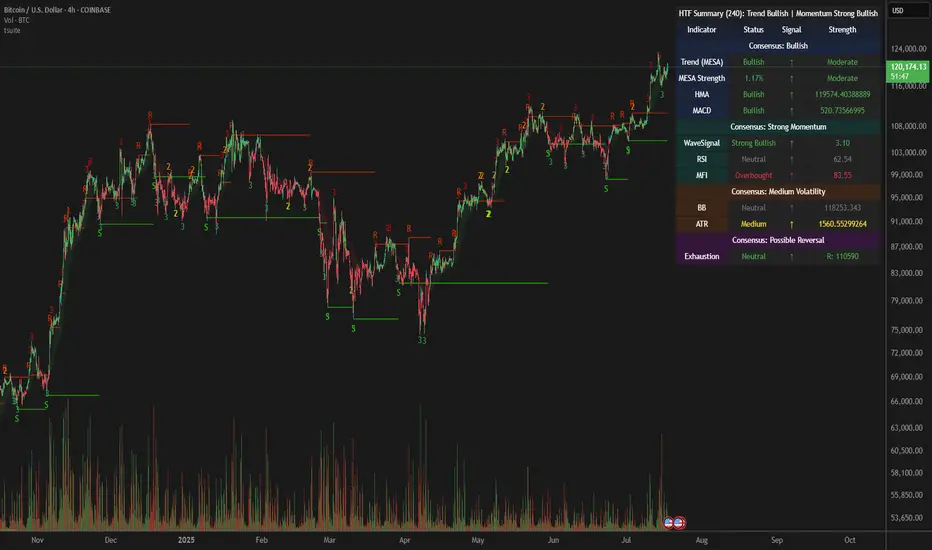
Mutanabby_AI | Ultimate Algo | Remastered+Overview
The Mutanabby_AI Ultimate Algo Remastered+ represents a sophisticated trend-following system that combines Supertrend analysis with multiple moving average confirmations. This comprehensive indicator is designed specifically for identifying high-probability trend continuation and reversal opportunities across various market conditions.
Core Algorithm Components
**Supertrend Foundation**: The primary signal generation relies on a customizable Supertrend indicator with adjustable sensitivity (1-20 range). This adaptive trend-following tool uses Average True Range calculations to establish dynamic support and resistance levels that respond to market volatility.
**SMA Confirmation Matrix**: Multiple Simple Moving Averages (SMA 4, 5, 9, 13) provide layered confirmation for signal strength. The algorithm distinguishes between regular signals and "Strong" signals based on SMA 4 vs SMA 5 relationship, offering traders different conviction levels for position sizing.
**Trend Ribbon Visualization**: SMA 21 and SMA 34 create a visual trend ribbon that changes color based on their relationship. Green ribbon indicates bullish momentum while red signals bearish conditions, providing immediate visual trend context.
**RSI-Based Candle Coloring**: Advanced 61-tier RSI system colors candles with gradient precision from deep red (RSI ≤20) through purple transitions to bright green (RSI ≥79). This visual enhancement helps traders instantly assess momentum strength and overbought/oversold conditions.
Signal Generation Logic
**Buy Signal Criteria**:
- Price crosses above Supertrend line
- Close price must be above SMA 9 (trend confirmation)
- Signal strength determined by SMA 4 vs SMA 5 relationship
- "Strong Buy" when SMA 4 ≥ SMA 5
- Regular "Buy" when SMA 4 < SMA 5
**Sell Signal Criteria**:
- Price crosses below Supertrend line
- Close price must be below SMA 9 (trend confirmation)
- Signal strength based on SMA relationship
- "Strong Sell" when SMA 4 ≤ SMA 5
- Regular "Sell" when SMA 4 > SMA 5
Advanced Risk Management System
**Automated TP/SL Calculation**: The indicator automatically calculates stop loss and take profit levels using ATR-based measurements. Risk percentage and ATR length are fully customizable, allowing traders to adapt to different market conditions and personal risk tolerance.
**Multiple Take Profit Targets**:
- 1:1 Risk-Reward ratio for conservative profit taking
- 2:1 Risk-Reward for balanced trade management
- 3:1 Risk-Reward for maximum profit potential
**Visual Risk Display**: All risk management levels appear as both labels and optional trend lines on the chart. Customizable line styles (solid, dashed, dotted) and positioning ensure clear visualization without chart clutter.
**Dynamic Level Updates**: Risk levels automatically recalculate with each new signal, maintaining current market relevance throughout position lifecycles.
Visual Enhancement Features
**Customizable Display Options**: Toggle trend ribbon, TP/SL levels, and risk lines independently. Decimal precision adjustments (1-8 decimal places) accommodate different instrument price formats and personal preferences.
**Professional Label System**: Clean, informative labels show entry points, stop losses, and take profit targets with precise price levels. Labels automatically position themselves for optimal chart readability.
**Color-Coded Momentum**: The gradient RSI candle coloring system provides instant visual feedback on momentum strength, helping traders assess market energy and potential reversal zones.
Implementation Strategy
**Timeframe Optimization**: The algorithm performs effectively across multiple timeframes, with higher timeframes (4H, Daily) providing more reliable signals for swing trading. Lower timeframes work well for day trading with appropriate risk adjustments.
**Sensitivity Adjustment**: Lower sensitivity values (1-5) generate fewer but higher-quality signals, ideal for conservative approaches. Higher sensitivity (15-20) increases signal frequency for active trading styles.
**Risk Management Integration**: Use the automated risk calculations as baseline parameters, adjusting risk percentage based on account size and market conditions. The 1:1, 2:1, 3:1 targets enable systematic profit-taking strategies.
Market Application
**Trend Following Excellence**: Primary strength lies in capturing significant trend movements through the Supertrend foundation with SMA confirmation. The dual-layer approach reduces false signals common in single-indicator systems.
**Momentum Assessment**: RSI-based candle coloring provides immediate momentum context, helping traders assess signal strength and potential continuation probability.
**Range Detection**: The trend ribbon helps identify ranging conditions when SMA 21 and SMA 34 converge, alerting traders to potential breakout opportunities.
Performance Optimization
**Signal Quality**: The requirement for both Supertrend crossover AND SMA 9 confirmation significantly improves signal reliability compared to basic trend-following approaches.
**Visual Clarity**: The comprehensive visual system enables rapid market assessment without complex calculations, ideal for traders managing multiple instruments.
**Adaptability**: Extensive customization options allow fine-tuning for specific markets, trading styles, and risk preferences while maintaining the core algorithm integrity.
## Non-Repainting Design
**Educational Note**: This indicator uses standard TradingView functions (Supertrend, SMA, RSI) with normal behavior patterns. Real-time updates on current candles are expected and standard across all technical indicators. Historical signals on closed candles remain fixed and unchanged, ensuring reliable backtesting and analysis.
**Signal Confirmation**: Final signals are confirmed only when candles close, following standard technical analysis principles. The algorithm provides clear distinction between developing signals and confirmed entries.
Technical Specifications
**Supertrend Parameters**: Default sensitivity of 4 with ATR length of 11 provides balanced signal generation. Sensitivity range from 1-20 allows adaptation to different market volatilities and trading preferences.
**Moving Average Configuration**: SMA periods of 8, 9, and 13 create multi-layered trend confirmation, while SMA 21 and 34 form the visual trend ribbon for broader market context.
**Risk Management**: ATR-based calculations with customizable risk percentage ensure dynamic adaptation to market volatility while maintaining consistent risk exposure principles.
Recommended Settings
**Conservative Approach**: Sensitivity 4-5, RSI length 14, higher timeframes (4H, Daily) for swing trading with maximum signal reliability.
**Active Trading**: Sensitivity 6-8, RSI length 8-10, intermediate timeframes (1H) for balanced signal frequency and quality.
**Scalping Setup**: Sensitivity 10-15, RSI length 5-8, lower timeframes (15-30min) with enhanced risk management protocols.
## Conclusion
The Mutanabby_AI Ultimate Algo Remastered+ combines proven trend-following principles with modern visual enhancements and comprehensive risk management. The algorithm's strength lies in its multi-layered confirmation approach and automated risk calculations, providing both novice and experienced traders with clear signals and systematic trade management.
Success with this system requires understanding the relationship between signal strength indicators and adapting sensitivity settings to match current market conditions. The comprehensive visual feedback system enables rapid decision-making while the automated risk management ensures consistent trade parameters.
Practice with different sensitivity settings and timeframes to optimize performance for your specific trading style and risk tolerance. The algorithm's systematic approach provides an excellent framework for disciplined trend-following strategies across various market environments.

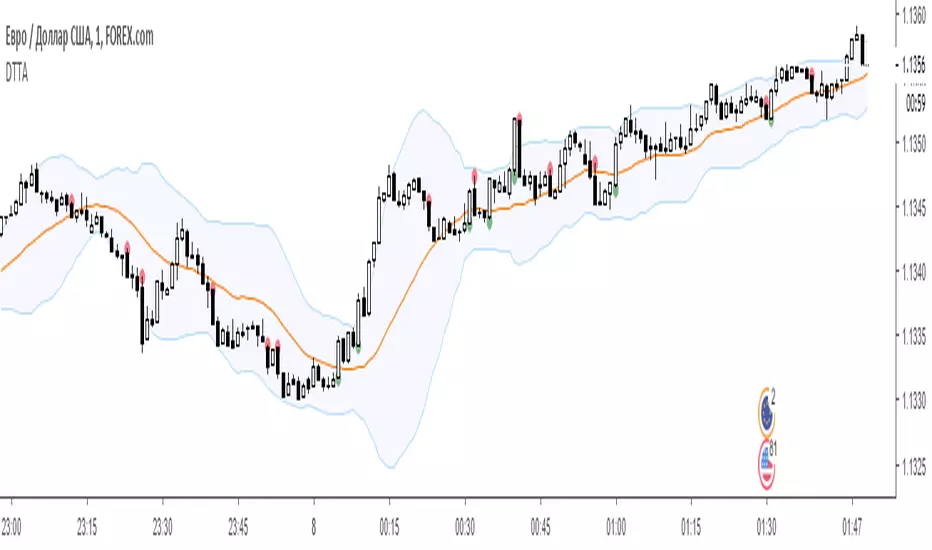
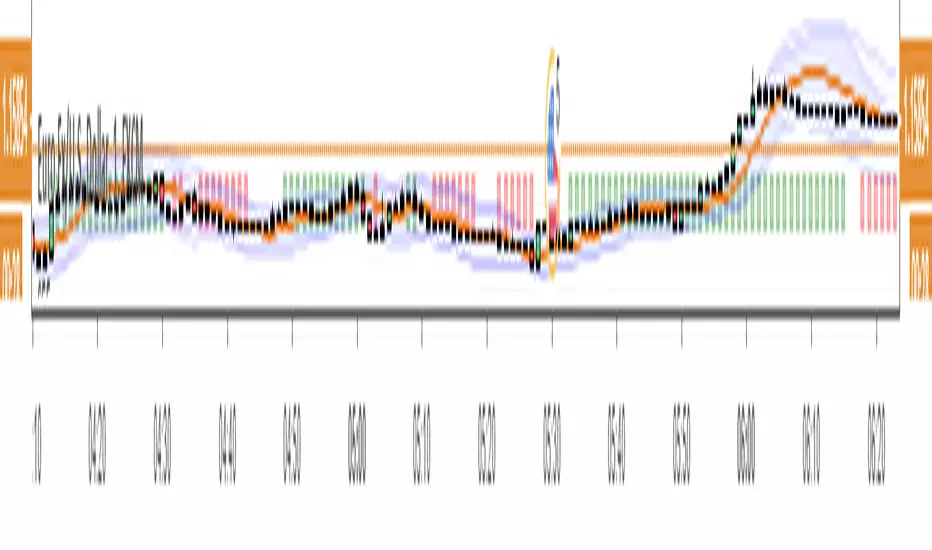
Volatility indicator based on ATR Hello,
I'm sharing to you a volatility indicator I've done in the last few weeks based on ATR. There is multiple functionalities on this indicator, the first one is an overlay displaying when an asset is in an "overvolatily zone"
(displayed with red cross) and when we are in an "undervolatily zone" (displayed with green cross). You can change the sensibility of the signals in the parameters if you wish to have more or less greedy signals
(it will only modify the overvolatility signals). By the way those signals are not working for week-ends because volatility works differently on week-ends and it's not a good idea to count week-ends in the calculations, so do not worry if you see no signals on weekends.
Second part of the indicator is something I called "Atr bands" it's an equivalent to the famous Bollinger-Bands but based on ATR. I haven't backtested them yet but they seems really interesting in low ut
(15 mins seems to be the best ut for those) and they seems pretty bad in high ut so they can maybe be useful for low ut scalping.
Last thing, there is a parameter allowing you to display bands on the week-ends so you can easily see where the indicator won't give signals.
I would be really happy if I could have some feedsback if you try the indicator :)
Have a wonderful day

TV Community AlgoTV Community Algo is a free TradingView script that I designed from the ground to benefit the traders of this community. It has plenty of features that you will enjoy, and I have included documentation for how to use this below!
Settings:
Basic:
Turn the Void Lines on or off
Turn the Dashboard on or off
Turn the Signal Bars on or off
Turn the Support & Resistance Lines on or off
Turn the EMA 8 and EMA 200 on or off
Turn the Buy & Sell Signals on or off
Turn the Fibonacci Retracement Tool on or off
Style:
Change the Dashboard's distance from the price action
Change the Dashboard's Color and Transparency
Change the Dashboard Text Color
Change the Fibonacci Deviation
Make the Fibonacci Retracement Tool reverse
Make the Fibonacci Lines extend left, right, both directions, or none
Turn Fibonacci Prices on or off
Turn Fibonacci Levels on or off and change between percent or value
Change Fibonacci Label Position from the left or the right
Usage:
This algo has many uses including but not limited to:
Finding entries and exits using the EMA 8 and EMA 200 crossovers
Using the Void Lines to identify bounces or reversals
Using the Signal Bars to identify trend and confirmation for entries and exits
Using the Dashboard information for confirmation and informational purposes
In the images below, I give a few examples of the many uses of the TV Community Algo!
VOID LINES
The Void Lines are very helpful when it comes to identifying reversals.
TV COMMUNITY ALGO DASHBOARD
The Dashboard is filled with useful information that all traders can benefit from!
SIGNAL BARS
The colored candles known as Signal Bars inform you of when the price action is above or below the midpoint of the Void Lines.
AUTO SUPPORT & RESISTANCE LINES
These lines help traders find accurate levels of support & resistance on all time frames, and the lines change color depending on if the price is above or below them.
EMA 8 AND 200
The EMA 8 and EMA 200 crossovers can be used as entry and exit signals.
BUY & SELL SIGNALS
The BUY & SELL signals can be used to find optimal entries and exits for trades on any time frame. Smaller time frames are best for scalping, while larger time frames are more suited for longer trades. When combined with the EMA lines and Dashboard information, these signals can produce incredibly profitable trades.
AUTO FIBONACCI RETRACEMENT TOOL
The Auto Fibonacci Retracement Tool allows you to plot perfect Fib Lines every time.
Conclusion:
I truly hope that the TV Community Algo benefits the TradingView community and that you all find some value in it. I worked very hard on this product and I would love to see it put to good use.
with love,
-Lemon 🍋
This work is licensed under a Attribution-NonCommercial-ShareAlike 4.0 International (CC BY-NC-SA 4.0) creativecommons.org

LordPepe Stochastic SignalsThis is the Lord Pepe. Howdy. Basic buy/sell indicator to accumulate along a downtrend and release your stack during the uptrend and oversold levels of the stochastic. The buys should be used to stack, and sells indicate levels of profit taking, they do not signal a long term reversal, only < 25% of stack should be released on "OB" signals.
OB - overbought (sell)
OS - oversold (buy)
function: Array DownsamplingA low cost function to down sample a array.
specially useful for pattern recognition algorithms.

Parabolic SAR [with Algorithm and Alerts]Hello All,
In one of my projects I needed Parabolic SAR algorithm. I decided to write it in Pine and publish it. Then I added Alerts and Labels. here it is ;)
ENJOY!

Data structure ListThe script shows a workaround for list in pine-script via drawings.
There are few restrictions with them:
1. The size of the list cannot be more that amount of allowed drawings (about 40 by now)
2. Because the list shares the space of drawings throughout the whole script, using drawings with the list must be careful, with handly creating and removing of each drawing, because otherwise pine's garbage collector might break the list
3. Setters and Getters must be called on every bar, because of implementation of functions in pine there are inner serieses, which must be updated on every bar. So wherever you have a setter or getter in the code - it must be called on every bar. But if it's just an update, then you should pass 'false' as a param of the funtion.
And an example of using the list - reversing of the list. When the list have been created, it's filled on every bar and then gets reversed. Plots show result before and after reversing of the list.
There are also some pieces of commented code showing possible way of working with another funtions of the list.

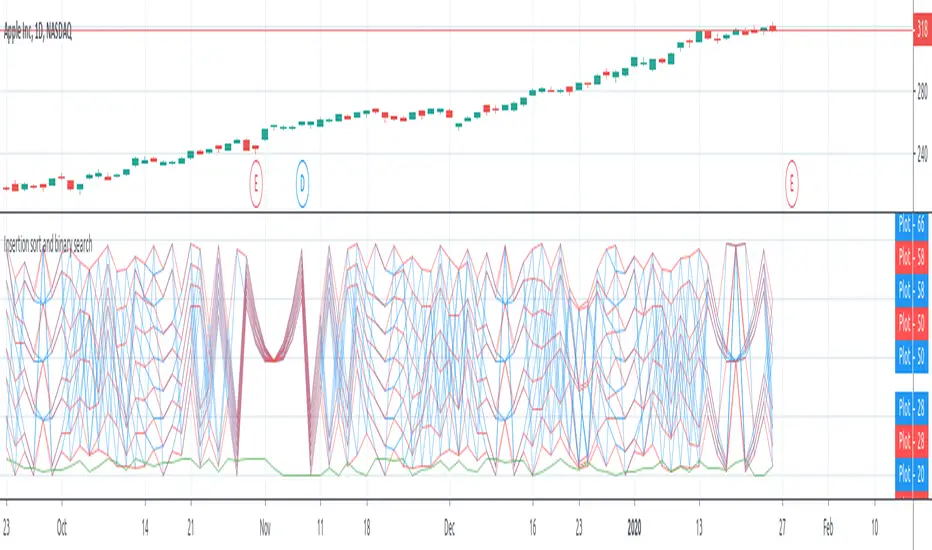
Insertion sort and binary searchThe script shows a workaround for arrays in pine-script via drawings.
There are few restrictions with them:
1. The length of the array cannot be more that amount of allowed drawings (about 40 by now)
2. Because the "array" shares the space of drawings throughout the whole script, using drawings with the "array" must be careful, with handly creating and removing of each drawing, because otherwise pine's garbage collector might break the "array"
3. Getter and Setter must be called on every bar, because of implementation of functions in pine there are inner serieses, which must be updated on every bar. So wherever you have a setter or getter in the code - it must be called on every bar. But if it's just an update, then you should pass 'false' as a param of the funtion.
The script also shows an example of implementation of Insertion sort of the array in pine: when the array have been created, it's filled with pseudo-random numbers and sorted on every bar. There are plotting of the array's numbers before/after soring to show the sorting result.
There's also an example of implementation of binary search: after generation elements of the array, the first element is kept in local variable and after sorting of the array, the scripts is looking for new element's position via binary search and then plot that new index in an array (last plotted value with the green color)
Dual Thrust Trading Algorithm (ps4)This is an PS4 update to the popular Dual Thrust trading algorithm posted by me some time ago (). It has been commonly used in futures, Forex and equity markets. The idea of Dual Thrust is similar to a typical breakout system, however dual thrust uses the historical price to construct update the look back period - theoretically making it more stable in any given period.
See: www.quantconnect.com

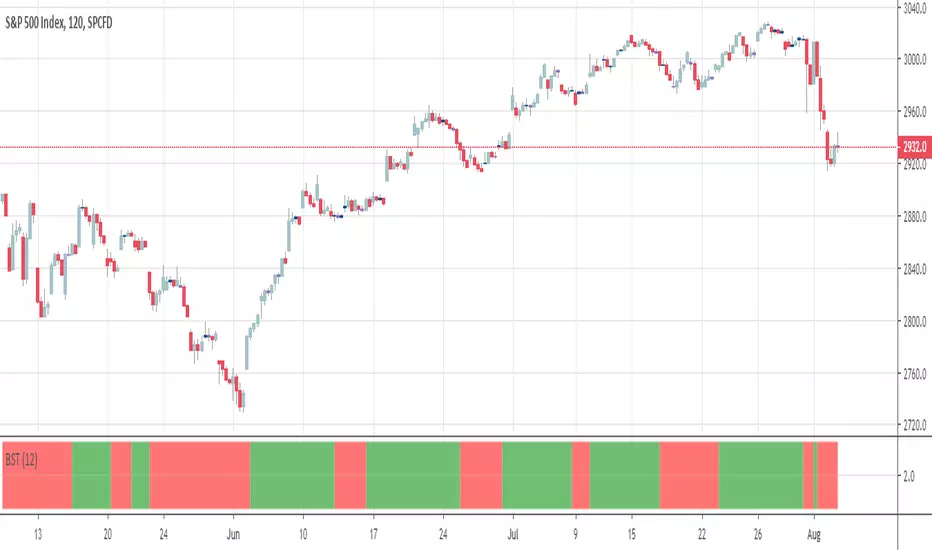
BSTtrend (and a quick note on trading psychology)Hi again :)
Script #2 for tonight, more to come :)
This one is a Pine transcription of a FXCM/LUA script called BSTrend
I used it years ago to trade index on very low timeframes with it. I'm always looking for oscillators that are more reactive than the traditional MACD. And even more reactive than the MACD Zero Lag
This is a proof of concept that Pinescript is my favorite trading programming language vs MT4/LUA/PRT. I just find it easier and the Pinescript community is helping a lot
With the BSTrend you can win but also lose. I see a lot of scripts out there but there is not a better or worst indicator. The key is HOW to use it.
In other words the key is your PSYCHOLOGY, without a rock-solid psychology, you'll end up committing a mistake even with G. himself whispering "BUY NOW", "SELL NOW" to your ears. (wait..... Do you mean this is happening only to me ????)
However, indicators help immensely in reducing the psychology pressure that we have to endure ... sometimes for days..... But better not to overcharge with dozens of indicators per chart and have a tool to detect whenever there is a confluence/convergence of your favorite indicators :) #algorithm #builder
I'll publish an educational post about next week
Those are the exact words that my mentor traders told me 6 years ago when I started trading
PS
____________________________________________________________
Be sure to hit the thumbs up as it shows me that I'm not doing this for nothing and will motivate to deliver more quality content in the future.
- I'm an officially approved PineEditor/LUA/MT4 approved mentor on codementor. You can request a coaching with me if you want and I'll teach you how to build kick-ass indicators and strategies
Jump on a 1 to 1 coaching with me
- You can also hire for a custom dev of your indicator/strategy/bot/chrome extension/python
Dual Thrust Trading AlgorithmThe Dual Thrust trading algorithm is a famous strategy developed by Michael Chalek. It has been commonly used in futures, forex and equity markets. The idea of Dual Thrust is similar to a typical breakout system, however dual thrust uses the historical price to construct update the look back period - theoretically making it more stable in any given period.