Advanced Bitcoin Cycle Detector with Projections & Hursttest script created with openrouter adn google gemmi 3
Bands and Channels

stock whisperersdfasow, why your line.new failed:
If Pine isn’t exactly v5, TradingView treats line like it doesn’t exist and throws “undeclared identifier”. That’s what you saw.
If you still want the fancy extending lines instead of plots, I can give you a version that forces Pine v5. But this one already does what you asked:
Shows the levels on top of candles, not in a lower pane.
Copy. Paste. Add. Done.
If it still breaks, the issue is your TradingView editor, not the code.

ATR Bands + Bollinger Bandsa combination used to show consolidation and break outs. break outs when bb is within atr and crosses above or below.

4H-1H Channel Confluence Strategy EN VersionA powerful multi-timeframe trend-following system based on 4H & 1H Donchian channels.
• 4H defines the main trend (green/red/yellow)
• 1H confirms short-term momentum
• Entries only at 4H channel support/resistance confluence
• Real support/resistance levels from high-volume candles only
• Clear LONG/SHORT signals on chart + info table
• Fully customizable colors and parameters

4H-1H Channel Confluence StrategyA powerful multi-timeframe trend-following system based on 4H & 1H Donchian channels.
• 4H defines the main trend (green/red/yellow)
• 1H confirms short-term momentum
• Entries only at 4H channel support/resistance confluence
• Real support/resistance levels from high-volume candles only
• Clear LONG/SHORT signals on chart + info table
• Fully customizable colors and parameters

Micha Stokes Buyers Breakout Alert v2I added comments starts with EE , where code modifications are needed

Low Volatility Profiles [BigBeluga]🔵 OVERVIEW
Low Volatility Profiles is a market compression and breakout-anticipation tool that identifies phases of low volatility using ADX and then builds a real-time volume profile inside the detected range.
This helps traders spot accumulation/distribution zones and prepare for explosive moves when volatility expands.
When volatility is low ➜ price coils ➜ volume organizes ➜ breakouts become highly actionable.
This tool visualizes that process with dynamic range boxes + volume bins + PoC extension.
🔵 CONCEPTS
Low-Volatility Detection — Uses ADX threshold & cross logic to define volatility contraction regimes.
Range Construction — Draws a price box that expands with highs/lows during the compression phase.
Micro Volume Profile — Builds a volume histogram inside the range using bins (micro volume nodes).
Delta Calculation — Tracks positive vs negative volume to gauge buyer/seller pressure within range.
Point of Control (PoC) — Highlights the price level with max traded volume inside the range.
PoC Extension — Optionally extends PoC into future bars to show potential reaction zone after breakout.
Breakout Validation — Ends the profile zone when price breaks above or below the modeled range.
Noise Removal — Automatically removes invalid or small ranges to prevent chart clutter.
This tool turns consolidation into actionable structure by exposing where smart money accumulates before trending moves.
🔵 FEATURES
ADX-Driven Range Detection — Identify when market transitions into low-volatility compression.
Configurable ADX Threshold — Set sensitivity for contraction zones.
Cross-Type Option — Detect low volatility via cross under / crossover logic.
Dynamic Range Box — Expands live with price as contraction unfolds.
Micro Volume Profile (Bins) — Distributes volume across bins inside range for micro POC mapping.
Volume Delta Visualization — Shows imbalance inside consolidation (accumulation vs distribution).
Real-Time PoC Highlight — Instantly shows most traded price inside the compression.
PoC Extension Mode — Extend PoC forward to project reaction levels post-breakout.
Clean Auto-Reset Logic — Removes boxes if range invalid or breakout occurs too fast.
Optional Filled Boxes — Heatmap-style profile visualization inside range body.
ADX Line + Threshold Plot — Visual assistance for volatility state monitoring.
🔵 HOW TO USE
Identify Accumulation Zones — When price enters low-volatility ADX condition and profile builds.
Watch the PoC — PoC acts as battle zone; move above/below can signal initiator strength.
Breakout Strategy — Trade break above/below the range after compression.
Mean Reversion Inside Range — Fade edges while price remains inside compression box.
Combine With Trend Tools — Use trend confirmation (MA/EMA/Flow indicators) after breakout.
Use Delta Clues — Positive delta tilt suggests accumulation; negative suggests distribution.
Monitor Range Size — Longer build + high PoC volume = stronger potential breakout energy.
🔵 CONCLUSION
Low Volatility Profiles isolates accumulation phases and maps volume concentration before volatility expansion.
By combining ADX compression, micro volume distribution, and PoC tracing, traders gain an edge in anticipating powerful breakout cycles and institutional positioning.
Trade the quiet moment before the storm — where smart money prepares the move, and the real opportunity emerges.

DeepClean Linear indicator 1. Indicator Name
DeepClean Linear indicator
2. One-Line Introduction
A trend-recognition indicator that overlays a “transparent wave” on price, removing noise and revealing directional bias and trend intensity in a highly intuitive visual form.
3. Overall Summary
The DeepClean Linear indicator calculates trend direction using changes in linear regression slope and determines trend strength by comparing how consistently the regression line moves over a defined lookback window.
Rather than merely identifying trend direction, the indicator applies a triple-layer noise-filtering process (EMA → SMA → RMA) to produce a clean, wave-shaped data line that filters out unnecessary market noise.
This transparent wave sits directly on top of price, allowing traders to visually compare price movement and trend strength at the same time.
A stronger trend results in a taller, thicker wave, while weakening momentum causes the wave to thin, making it easier to spot trend continuation, exhaustion, or upcoming reversal.
Color automatically shifts based on trend:
Bright cyan/teal during bullish conditions
Reddish tones during bearish conditions
Transparency dynamically adjusts depending on strength
The indicator excels at identifying the true underlying trend by ignoring minor fluctuations and is well suited for scalping, swing trading, and position trading.
It also significantly reduces false signals in ranging markets, making it ideal for trend-following strategies.
4. Advantages
① Ultra-Clean Noise-Reduced Wave
Utilizes a 3-stage smoothing filter (EMA → SMA → RMA) to produce a much cleaner wave than standard moving averages, highlighting only core trend movement.
② Trend Direction & Strength at a Glance
Based on comparative linear regression behavior, the indicator quantifies both direction and strength, making convergence/divergence highly visible.
③ Intuitive Price Overlay Visualization
The semi-transparent wave sits directly on price action, allowing traders to instantly see divergence from price, trend weakening, or early turning points.
④ Dynamic Transparency Coloring
Strong trends appear bold and intense, while weaker trends fade visually—making signal interpretation effortless.
⑤ Excellent Range Filtering
During low-direction phases (state = 0), the wave turns neutral, preventing forced or premature entries.
⑥ Multi-Timeframe Compatibility
The wave remains stable from 1-minute to weekly charts, making it suitable for trend analysis, execution, and risk control across all timeframes.
📌 Core Concept Overview
The indicator evaluates the relative comparison of linear regression values over the last n periods.
A positive trend value indicates bullish bias
A negative trend value indicates bearish bias
Intensity represents strength and controls wave height
waveTop / waveBot define the visual wave area relative to price
State Values
1 = Bullish Trend
-1 = Bearish Trend
0 = Neutral / Weak Direction
⚙️ Settings Overview
Option Description
Trend Lookback (n) Comparison window for regression slope. Higher = bigger trend focus.
Range Tolerance (%) Strength threshold to classify bullish/bearish movement. Higher = more conservative.
Source Price source for regression calculations.
Linear Reg Length Length of the linear regression.
Noise Filter Strength (smoothK) Controls the smoothing intensity. Higher = smoother wave.
Wave Amplitude (amp) Adjusts the height/thickness of the wave.
Bull/Bear Color Colors for bullish/bearish waves.
Base Transparency Base opacity level; modified dynamically by trend strength.
📈 Bullish Timing Recognition Examples
Wave begins turning brighter teal and more opaque, indicating strengthening upward pressure.
waveTop expands above price, signaling early trend expansion.
State flips to 1, often marking a trend restart or early reversal phase.
A steadily rising wave height suggests sustained bullish momentum.
📉 Bearish Timing Recognition Examples
Wave shifts into red tones, showing bearish dominance.
waveBot expands below price, indicating rising downside volatility.
State stays at -1 while intensity increases, signaling entry into strong downtrend conditions.
A shift from weak → strong bearish intensity can provide short-entry timing cues.
🧪 Recommended Usage
Use as a core component in trend-following systems
Adjust position size based on wave thickness (trend strength)
Combine with RSI/MACD to reduce false signals during overbought/oversold zones
Sudden wave expansion during volatility increases helps detect trend acceleration
In sideways markets, frequent state = 0 readings help avoid low-probability trades
🔒 Important Notes
As a trend-based indicator, it may misread choppy/ranging markets
Because of smoothing, signals may appear slightly delayed
Extreme news volatility can temporarily distort trend clarity

Sideways & Breakout Detector + Forecast//@version=6
indicator("Sideways & Breakout Detector + Forecast", overlay=true, max_labels_count=500)
// Inputs
lengthATR = input.int(20, "ATR Länge")
lengthMA = input.int(50, "Trend MA Länge")
sqFactor = input.float(1.2, "Seitwärtsfaktor")
brkFactor = input.float(1.5, "Breakoutfaktor")
// ATR / Volatilität
atr = ta.atr(lengthATR)
atrSMA = ta.sma(atr, lengthATR)
// Basislinie / Trend
basis = ta.sma(close, lengthATR)
trendMA = ta.sma(close, lengthMA)
// Seitwärtsbedingung
isSideways = atr < atrSMA * sqFactor
// Breakouts
upperBreak = close > basis + atr * brkFactor
lowerBreak = close < basis - atr * brkFactor
// Vorhergesagter Ausbruch (Forecast)
// Wenn Seitwärtsphase + Kurs nahe obere oder untere Kanalgrenze
forecastBull = isSideways and (close > basis + 0.5 * atr)
forecastBear = isSideways and (close < basis - 0.5 * atr)
// Farben
barcolor(isSideways ? color.new(color.yellow, 40) : na)
barcolor(upperBreak ? color.green : na)
barcolor(lowerBreak ? color.red : na)
// Breakout-Bänder
plot(basis + atr * brkFactor, "Bull Break Zone", color=color.new(color.green, 60))
plot(basis - atr * brkFactor, "Bear Break Zone", color=color.new(color.red, 60))
// Labels (klein)
if isSideways
label.new(bar_index, close, "Seitwärts", color=color.yellow, style=label.style_label_center, size=size.tiny)
if upperBreak
label.new(bar_index, high, "Bull Breakout", color=color.green, style=label.style_label_up, size=size.tiny)
if lowerBreak
label.new(bar_index, low, "Bear Breakout", color=color.red, style=label.style_label_down, size=size.tiny)
// Vorhergesagte Ausbrüche markieren
plotshape(forecastBull, title="Forecast Bull", location=location.abovebar, color=color.new(color.green, 0), style=shape.triangleup, size=size.tiny)
plotshape(forecastBear, title="Forecast Bear", location=location.belowbar, color=color.new(color.red, 0), style=shape.triangledown, size=size.tiny)
// Alerts
alertcondition(isSideways, "Seitwärtsphase", "Der Markt läuft seitwärts.")
alertcondition(upperBreak, "Bull Breakout", "Ausbruch nach oben!")
alertcondition(lowerBreak, "Bear Breakout", "Ausbruch nach unten!")
alertcondition(forecastBull, "Forecast Bull", "Voraussichtlicher Bull-Ausbruch!")
alertcondition(forecastBear, "Forecast Bear", "Voraussichtlicher Bear-Ausbruch!")

i don want to tell you how to use
"Regarding the specific inquiry into the precise manner and method by which one might go about employing the features present herein, I have decided, after much deliberation and careful consideration of all variable factors, to abstain from delivering a prescriptive lecture, thereby allowing the operational paradigm to remain an open-ended question for you to resolve."

Sniper Entry AU - AYUSHThis indicator combines EMA 9, EMA 15, and VWAP to identify trend direction and intraday strength. EMA 9 and EMA 15 show short-term momentum and crossover signals, while VWAP acts as an institutional reference point for fair value. Together, they help traders spot trend continuation, pullbacks, and high-quality entry zones during intraday sessions.

Sniper Entry 🚀🚀 {_AU_} EMA 9 + EMA 15 + VWAP BY = AU AYUSH
This indicator combines EMA 9, EMA 15, and VWAP to identify trend direction and intraday strength. EMA 9 and EMA 15 show short-term momentum and crossover signals, while VWAP acts as an institutional reference point for fair value. Together, they help traders spot trend continuation, pullbacks, and high-quality entry zones during intraday sessions.

لbsm15// This work is licensed under a Attribution-NonCommercial-ShareAlike 4.0 International (CC BY-NC-SA 4.0) creativecommons.org
// © LuxAlgo
//@version=5
indicator("لbsm15", overlay = true, max_lines_count = 500, max_boxes_count = 500, max_bars_back = 3000)
//------------------------------------------------------------------------------
//Settings
//-----------------------------------------------------------------------------{
liqGrp = 'Liquidity Detection'
liqLen = input.int (7, title = 'Detection Length', minval = 3, maxval = 13, inline = 'LIQ', group = liqGrp)
liqMar = 10 / input.float (6.9, 'Margin', minval = 4, maxval = 9, step = 0.1, inline = 'LIQ', group = liqGrp)
liqBuy = input.bool (true, 'Buyside Liquidity Zones, Margin', inline = 'Buyside', group = liqGrp)
marBuy = input.float(2.3, '', minval = 1.5, maxval = 10, step = .1, inline = 'Buyside', group = liqGrp)
cLIQ_B = input.color (color.new(#4caf50, 0), '', inline = 'Buyside', group = liqGrp)
liqSel = input.bool (true, 'Sellside Liquidity Zones, Margin', inline = 'Sellside', group = liqGrp)
marSel = input.float(2.3, '', minval = 1.5, maxval = 10, step = .1, inline = 'Sellside', group = liqGrp)
cLIQ_S = input.color (color.new(#f23645, 0), '', inline = 'Sellside', group = liqGrp)
lqVoid = input.bool (false, 'Liquidity Voids, Bullish', inline = 'void', group = liqGrp)
cLQV_B = input.color (color.new(#4caf50, 0), '', inline = 'void', group = liqGrp)
cLQV_S = input.color (color.new(#f23645, 0), 'Bearish', inline = 'void', group = liqGrp)
lqText = input.bool (false, 'Label', inline = 'void', group = liqGrp)
mode = input.string('Present', title = 'Mode', options = , inline = 'MOD', group = liqGrp)
visLiq = input.int (3, ' # Visible Levels', minval = 1, maxval = 50, inline = 'MOD', group = liqGrp)
//-----------------------------------------------------------------------------}
//General Calculations
//-----------------------------------------------------------------------------{
maxSize = 50
atr = ta.atr(10)
atr200 = ta.atr(200)
per = mode == 'Present' ? last_bar_index - bar_index <= 500 : true
//-----------------------------------------------------------------------------}
//User Defined Types
//-----------------------------------------------------------------------------{
// @type used to store pivot high/low data
//
// @field d (array) The array where the trend direction is to be maintained
// @field x (array) The array where the bar index value of pivot high/low is to be maintained
// @field y (array) The array where the price value of pivot high/low is to be maintained
type ZZ
int d
int x
float y
// @type bar properties with their values
//
// @field o (float) open price of the bar
// @field h (float) high price of the bar
// @field l (float) low price of the bar
// @field c (float) close price of the bar
// @field i (int) index of the bar
type bar
float o = open
float h = high
float l = low
float c = close
int i = bar_index
// @type liquidity object definition
//
// @field bx (box) box maitaing the liquity level margin extreme levels
// @field bxz (box) box maitaing the liquity zone margin extreme levels
// @field bxt (box) box maitaing the labels
// @field brZ (bool) mainains broken zone status
// @field brL (bool) mainains broken level status
// @field ln (line) maitaing the liquity level line
// @field lne (line) maitaing the liquity extended level line
type liq
box bx
box bxz
box bxt
bool brZ
bool brL
line ln
line lne
//-----------------------------------------------------------------------------}
//Variables
//-----------------------------------------------------------------------------{
var ZZ aZZ = ZZ.new(
array.new (maxSize, 0),
array.new (maxSize, 0),
array.new (maxSize, na)
)
bar b = bar.new()
var liq b_liq_B = array.new (1, liq.new(box(na), box(na), box(na), false, false, line(na), line(na)))
var liq b_liq_S = array.new (1, liq.new(box(na), box(na), box(na), false, false, line(na), line(na)))
var b_liq_V = array.new_box()
var int dir = na, var int x1 = na, var float y1 = na, var int x2 = na, var float y2 = na
//-----------------------------------------------------------------------------}
//Functions/methods
//-----------------------------------------------------------------------------{
// @function maintains arrays
// it prepends a `value` to the arrays and removes their oldest element at last position
// @param aZZ (UDT, array, array>) The UDT obejct of arrays
// @param _d (array) The array where the trend direction is maintained
// @param _x (array) The array where the bar index value of pivot high/low is maintained
// @param _y (array) The array where the price value of pivot high/low is maintained
//
// @returns none
method in_out(ZZ aZZ, int _d, int _x, float _y) =>
aZZ.d.unshift(_d), aZZ.x.unshift(_x), aZZ.y.unshift(_y), aZZ.d.pop(), aZZ.x.pop(), aZZ.y.pop()
// @function (build-in) sets the maximum number of bars that is available for historical reference
max_bars_back(time, 1000)
//-----------------------------------------------------------------------------}
//Calculations
//-----------------------------------------------------------------------------{
x2 := b.i - 1
ph = ta.pivothigh(liqLen, 1)
pl = ta.pivotlow (liqLen, 1)
if ph
dir := aZZ.d.get(0)
x1 := aZZ.x.get(0)
y1 := aZZ.y.get(0)
y2 := nz(b.h )
if dir < 1
aZZ.in_out(1, x2, y2)
else
if dir == 1 and ph > y1
aZZ.x.set(0, x2), aZZ.y.set(0, y2)
if per
count = 0
st_P = 0.
st_B = 0
minP = 0.
maxP = 10e6
for i = 0 to maxSize - 1
if aZZ.d.get(i) == 1
if aZZ.y.get(i) > ph + (atr / liqMar)
break
else
if aZZ.y.get(i) > ph - (atr / liqMar) and aZZ.y.get(i) < ph + (atr / liqMar)
count += 1
st_B := aZZ.x.get(i)
st_P := aZZ.y.get(i)
if aZZ.y.get(i) > minP
minP := aZZ.y.get(i)
if aZZ.y.get(i) < maxP
maxP := aZZ.y.get(i)
if count > 2
getB = b_liq_B.get(0)
if st_B == getB.bx.get_left()
getB.bx.set_top(math.avg(minP, maxP) + (atr / liqMar))
getB.bx.set_rightbottom(b.i + 10, math.avg(minP, maxP) - (atr / liqMar))
else
b_liq_B.unshift(
liq.new(
box.new(st_B, math.avg(minP, maxP) + (atr / liqMar), b.i + 10, math.avg(minP, maxP) - (atr / liqMar), bgcolor=color(na), border_color=color(na)),
box.new(na, na, na, na, bgcolor = color(na), border_color = color(na)),
box.new(st_B, st_P, b.i + 10, st_P, text = 'Buyside liquidity', text_size = size.tiny, text_halign = text.align_left, text_valign = text.align_bottom, text_color = color.new(cLIQ_B, 25), bgcolor = color(na), border_color = color(na)),
false,
false,
line.new(st_B , st_P, b.i - 1, st_P, color = color.new(cLIQ_B, 0)),
line.new(b.i - 1, st_P, na , st_P, color = color.new(cLIQ_B, 0), style = line.style_dotted))
)
alert('buyside liquidity level detected/updated for ' + syminfo.ticker)
if b_liq_B.size() > visLiq
getLast = b_liq_B.pop()
getLast.bx.delete()
getLast.bxz.delete()
getLast.bxt.delete()
getLast.ln.delete()
getLast.lne.delete()
if pl
dir := aZZ.d.get (0)
x1 := aZZ.x.get (0)
y1 := aZZ.y.get (0)
y2 := nz(b.l )
if dir > -1
aZZ.in_out(-1, x2, y2)
else
if dir == -1 and pl < y1
aZZ.x.set(0, x2), aZZ.y.set(0, y2)
if per
count = 0
st_P = 0.
st_B = 0
minP = 0.
maxP = 10e6
for i = 0 to maxSize - 1
if aZZ.d.get(i) == -1
if aZZ.y.get(i) < pl - (atr / liqMar)
break
else
if aZZ.y.get(i) > pl - (atr / liqMar) and aZZ.y.get(i) < pl + (atr / liqMar)
count += 1
st_B := aZZ.x.get(i)
st_P := aZZ.y.get(i)
if aZZ.y.get(i) > minP
minP := aZZ.y.get(i)
if aZZ.y.get(i) < maxP
maxP := aZZ.y.get(i)
if count > 2
getB = b_liq_S.get(0)
if st_B == getB.bx.get_left()
getB.bx.set_top(math.avg(minP, maxP) + (atr / liqMar))
getB.bx.set_rightbottom(b.i + 10, math.avg(minP, maxP) - (atr / liqMar))
else
b_liq_S.unshift(
liq.new(
box.new(st_B, math.avg(minP, maxP) + (atr / liqMar), b.i + 10, math.avg(minP, maxP) - (atr / liqMar), bgcolor=color(na), border_color=color(na)),
box.new(na, na, na, na, bgcolor=color(na), border_color=color(na)),
box.new(st_B, st_P, b.i + 10, st_P, text = 'Sellside liquidity', text_size = size.tiny, text_halign = text.align_left, text_valign = text.align_top, text_color = color.new(cLIQ_S, 25), bgcolor=color(na), border_color=color(na)),
false,
false,
line.new(st_B , st_P, b.i - 1, st_P, color = color.new(cLIQ_S, 0)),
line.new(b.i - 1, st_P, na , st_P, color = color.new(cLIQ_S, 0), style = line.style_dotted))
)
alert('sellside liquidity level detected/updated for ' + syminfo.ticker)
if b_liq_S.size() > visLiq
getLast = b_liq_S.pop()
getLast.bx.delete()
getLast.bxz.delete()
getLast.bxt.delete()
getLast.ln.delete()
getLast.lne.delete()
for i = 0 to b_liq_B.size() - 1
x = b_liq_B.get(i)
if not x.brL
x.lne.set_x2(b.i)
if b.h > x.bx.get_top()
x.brL := true
x.brZ := true
alert('buyside liquidity level breached for ' + syminfo.ticker)
x.bxz.set_lefttop(b.i - 1, math.min(x.ln.get_y1() + marBuy * (atr), b.h))
x.bxz.set_rightbottom(b.i + 1, x.ln.get_y1())
x.bxz.set_bgcolor(color.new(cLIQ_B, liqBuy ? 73 : 100))
else if x.brZ
if b.l > x.ln.get_y1() - marBuy * (atr) and b.h < x.ln.get_y1() + marBuy * (atr)
x.bxz.set_right(b.i + 1)
x.bxz.set_top(math.max(b.h, x.bxz.get_top()))
if liqBuy
x.lne.set_x2(b.i + 1)
else
x.brZ := false
for i = 0 to b_liq_S.size() - 1
x = b_liq_S.get(i)
if not x.brL
x.lne.set_x2(b.i)
if b.l < x.bx.get_bottom()
x.brL := true
x.brZ := true
alert('sellside liquidity level breached for ' + syminfo.ticker)
x.bxz.set_lefttop(b.i - 1, x.ln.get_y1())
x.bxz.set_rightbottom(b.i + 1, math.max(x.ln.get_y1() - marSel * (atr), b.l))
x.bxz.set_bgcolor(color.new(cLIQ_S, liqSel ? 73 : 100))
else if x.brZ
if b.l > x.ln.get_y1() - marSel * (atr) and b.h < x.ln.get_y1() + marSel * (atr)
x.bxz.set_rightbottom(b.i + 1, math.min(b.l, x.bxz.get_bottom()))
if liqSel
x.lne.set_x2(b.i + 1)
else
x.brZ := false
if lqVoid and per
bull = b.l - b.h > atr200 and b.l > b.h and b.c > b.h
bear = b.l - b.h > atr200 and b.h < b.l and b.c < b.l
if bull
l = 13
if bull
st = math.abs(b.l - b.l ) / l
for i = 0 to l - 1
array.push(b_liq_V, box.new(b.i - 2, b.l + i * st, b.i, b.l + (i + 1) * st, border_color = na, bgcolor = color.new(cLQV_B, 90) ))
else
st = math.abs(b.l - b.h ) / l
for i = 0 to l - 1
if lqText and i == 0
array.push(b_liq_V, box.new(b.i - 2, b.h + i * st, b.i, b.h + (i + 1) * st, text = 'Liquidity Void ', text_size = size.tiny, text_halign = text.align_right, text_valign = text.align_bottom, text_color = na, border_color = na, bgcolor = color.new(cLQV_B, 90) ))
else
array.push(b_liq_V, box.new(b.i - 2, b.h + i * st, b.i, b.h + (i + 1) * st, border_color = na, bgcolor = color.new(cLQV_B, 90) ))
if bear
l = 13
if bear
st = math.abs(b.h - b.h) / l
for i = 0 to l - 1
array.push(b_liq_V, box.new(b.i - 2, b.h + i * st, b.i, b.h + (i + 1) * st, border_color = na, bgcolor = color.new(cLQV_S, 90) ))
else
st = math.abs(b.l - b.h) / l
for i = 0 to l - 1
if lqText and i == l - 1
array.push(b_liq_V, box.new(b.i - 2, b.h + i * st, b.i, b.h + (i + 1) * st, text = 'Liquidity Void ', text_size = size.tiny, text_halign = text.align_right, text_valign = text.align_top, text_color = na, border_color = na, bgcolor = color.new(cLQV_S, 90) ))
else
array.push(b_liq_V, box.new(b.i - 2, b.h + i * st, b.i, b.h + (i + 1) * st, border_color = na, bgcolor = color.new(cLQV_S, 90) ))
if b_liq_V.size() > 0
qt = b_liq_V.size()
for bn = qt - 1 to 0
if bn < b_liq_V.size()
cb = b_liq_V.get(bn)
ba = math.avg(cb.get_bottom(), cb.get_top())
if math.sign(b.c - ba) != math.sign(b.c - ba) or math.sign(b.c - ba) != math.sign(b.l - ba) or math.sign(b.c - ba) != math.sign(b.h - ba)
b_liq_V.remove(bn)
else
cb.set_right(b.i + 1)
if b.i - cb.get_left() > 21
cb.set_text_color(color.new(color.gray, 25))
//-----------------------------------------------------------------------------}

SuperTrend Zone Rejection [STRZ] CONCEPT -
This indicator identifies trend-continuation setups by combining the Super Trend with dynamic Average True Range (ATR) value zones. It highlights specific price action behaviour's—specifically wick rejections and momentum closes—that occur during pullbacks into the trend baseline.
HOW IT WORKS -
The script operates on three logic gates:
>> Trend Filter: Uses a standard Super Trend (Factor 3, Period 10 default) to define market direction.
>> Dynamic Zones: Projects a volatility-based zone (default 2.0x ATR) above or below the Super Trend line to define a valid pullback area.
>> Signal Detection: Identifies specific candle geometries occurring within these zones.
>> Rejection: Candles with significant wicks testing the zone support/resistance.
>> Momentum: Candles that open within the zone and close in the upper/lower quartile of their range.
FEATURES -
>> Dynamic Channel: Visualizes the active buy/sell zone using a continuous, non-repainting box.
>> Volatile Filtering: Filters out low-volatility candles (doji's/noise) based on minimum ATR size.
>> Visuals: Color-coded trend visualization with distinct signal markers for qualified entries.
SETTINGS -
>> Super Trend: Adjustable Factor and ATR Period.
>> Zone Multiplier: Controls the width of the pullback zone relative to ATR.
>> Visuals: Customizable colours for zones and signals to fit light/dark themes.

Highlight Running 30m CandleThis script highlight 30 minute running candle.
mostly used for crypto trading

KuberakshKuberaksh is a dynamic, trend-following indicator designed to identify market direction and potential reversals with high clarity. Built on the core logic of the HalfTrend, this script provides traders with clean, actionable signals and visual confirmation of channel deviation.
🔑 Key Features & Logic
Adaptive Trend Detection: The indicator calculates the main trend line (ht) by tracking the price using an Average True Range (ATR) and combining it with Exponential Moving Average (EMA) principles applied to the highest and lowest prices.
Deviation Ribbons: It plots dynamic ATR High and ATR Low ribbons around the HalfTrend line, colored green (buy) or red (sell), which visually represent the current market volatility and channel extremes.
Reversal Signals: Clear Buy and Sell signals are generated when the price breaks the prior trend channel and the internal high/low tracking confirms a switch in direction. These signals are marked by arrows and optional labels.

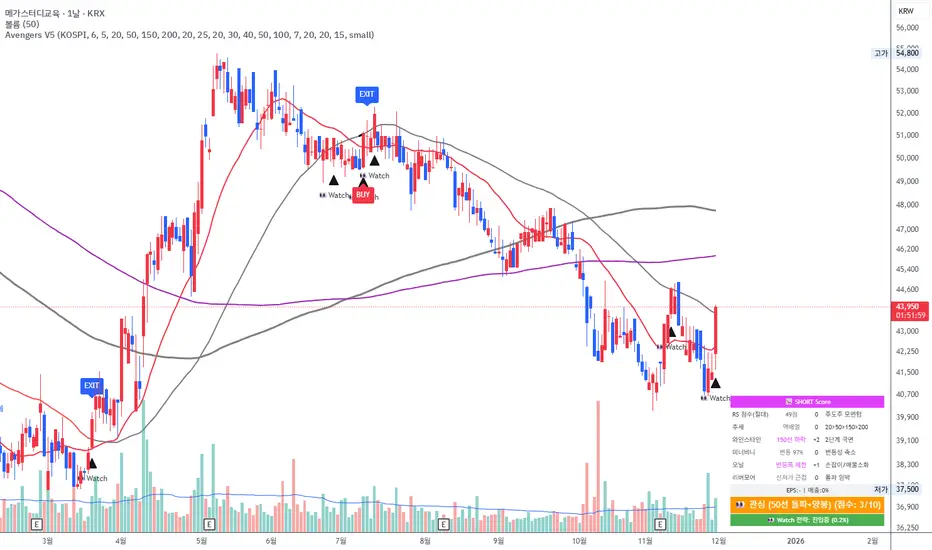
Avengers Ultimate V5 (Watch Profit)"Designed as a trend-following system, this strategy integrates the core principles of legends like Mark Minervini, Stan Weinstein, William O'Neil, and Jesse Livermore. It has been fine-tuned for the Korean market and provides distinct entry and exit protocols for different market scenarios."
Sk M Sir JiSimple indicator that plots three alma moving averages and provides bgcolor based on below conditions
Red => If RSI (length 14) is below 50 or low is below the lower Bollinger band (length 20)
Green => If RSI (length 14) is above 50 or high is above the upper Bollinger band (length 20)

Stat Map Pro: Z-Score + RSI + Vol + Div StatMap Ultimate is a multi‑factor statistical mapping tool designed to give traders a deeper view of market extremes, momentum, and hidden divergences. By combining Z‑Score analysis, RSI momentum signals, volume spikes, and divergence detection, this indicator helps you spot high‑probability turning points and confluence setups with clarity.
🔑 Key Features
- Z‑Score Candles: Price is normalized against its statistical mean, showing how far OHLC values deviate from equilibrium. This makes overbought/oversold zones (+2σ / ‑2σ) visually clear.
- RSI Integration: Candle coloring adapts to RSI momentum, highlighting bullish/ bearish bias and extreme conditions (OB/OS).
- Volume Spike Detection: Borders and wicks turn gold when volume exceeds a customizable threshold, signaling strong participation.
- Divergence Mapping: Automatic detection of bullish and bearish divergences between price and Z‑Score pivots, plotted directly on the chart.
- Confluence Signals: Simple circle markers highlight extreme setups where Z‑Score and RSI align, helping traders identify potential reversals.
🎯 How to Use
- Watch for Z‑Score extremes (+2σ / ‑2σ) combined with RSI OB/OS for potential turning points.
- Use gold volume spikes to confirm strong market interest.
- Pay attention to divergence labels (Bull Div / Bear Div) for early reversal clues.
- Combine signals for high‑confidence entries/exits in your trading strategy.
⚡ Why It’s Powerful
Stat Map Pro transforms raw price, momentum, and volume data into a unified statistical framework. Instead of relying on a single indicator, you get a multi‑layered confluence map that highlights when markets are stretched, exhausted, or primed for reversal.

Buy/Sell Signals [WynTrader]Hello dear Friend
Here is a new version ( B-S_251121_wt ) of my Buy/Sell Signals indicator.
Some calculation updates and useful enhancements have been applied.
Concepts
This Buy/Sell Signals indicator generates Buy/Sell signals as accurately as possible, identifying trend changes. Compared to other tools that detect trend shifts, this one is simple, easy to use, and demonstrates its efficiency on its own.
- Its features are carefully designed to minimize false signals while ensuring optimal signal placement.
- The Table results allow you to quickly evaluate signal performance, both on their own and compared to a Buy & Hold strategy.
- The Table calculations are fully synchronized with the visible chart (WYSIWYG – What You See Is What You Get). You can also scroll the chart across different date ranges to see how a stock or product performs under various market conditions.
- Seeing Buy/Sell signals on a chart is appealing, but assessing their performance in a Table makes it even more convincing. And without running a full backtest, you can get a clear overview of overall performance immediately.
Features
This indicator generates Buy/Sell signals using:
- Fast and Slow Moving Averages (adjustable).
- Bollinger Bands (adjustable).
- Filters (optional, adjustable) to refine signals, including : Bollinger Bands Lookback Trend Filter; High-Low vs Candle Range Threshold %; Distance from Fast and Slow MAs Threshold %.
- Results are displayed in a Table on the chart, based on the currently visible start and end dates.
Functionality
- The indicator aims to confirm trend changes through timely Buy/Sell signals.
- It uses two Moving Averages and Bollinger Bands, combined with filters such as BB Lookback, -- The variable settings have been tested with a mix of manual and AI testing to find the optimal configuration. You can adjust the variables to suit your goals.
- The design is simple, with clear parameters and instant readability of Buy/Sell Signals on the chart and in the Table results, without complex interpretation needed.
- It works effectively by requiring both trend confirmation and volatility control management.
- Signals are timed to be as accurate as possible, avoiding futile weak or false ones.
- A Table shows the effectiveness of the signals on the current visible chart, providing immediate, realistic feedback. The Buy & Hold strategy results are also included for comparison with the Buy/Sell swing strategy. The Buy & Hold results start from the first Buy signal to ensure a fair comparison.
- Changing the parameters instantly updates the Table, giving a quick, at-a-glance performance check.
Caution
- No technical tool is perfect; it cannot predict disasters, wars, or the actions of large fund managers or short sellers.
- After testing thousands of TradingView indicators over 24 years, I’ve found none to be 100% accurate all the time.
- This Buy/Sell Signals indicator may outperform some others but is still not perfect.
So, just be aware, and don’t be fooled by this tool.

Alpha Net Matrix ProAlpha Net Matrix Pro is an advanced momentum and volatility-based indicator that applies Gaussian smoothing and adaptive deviation bands to detect potential reversal zones and breakout points. It provides traders with dynamic visual cues that reflect real-time market behavior and price extremes.

Modello Espansione 1 – Monday Range + ClustersONLY M1 to M30. Don't work on H1 or more. Don't know how i'm watching 😳

TDI DIVERGENCEThis indicator, along with the TDI indicator: http , can offer trusted signals to enter and exit.
and just can be used as a complete trading system.
You can send your feedback and comments to my email
