smolka Bayesian Volatile ChannelDescription in English and Russian.
Bayesian Volatile Channel
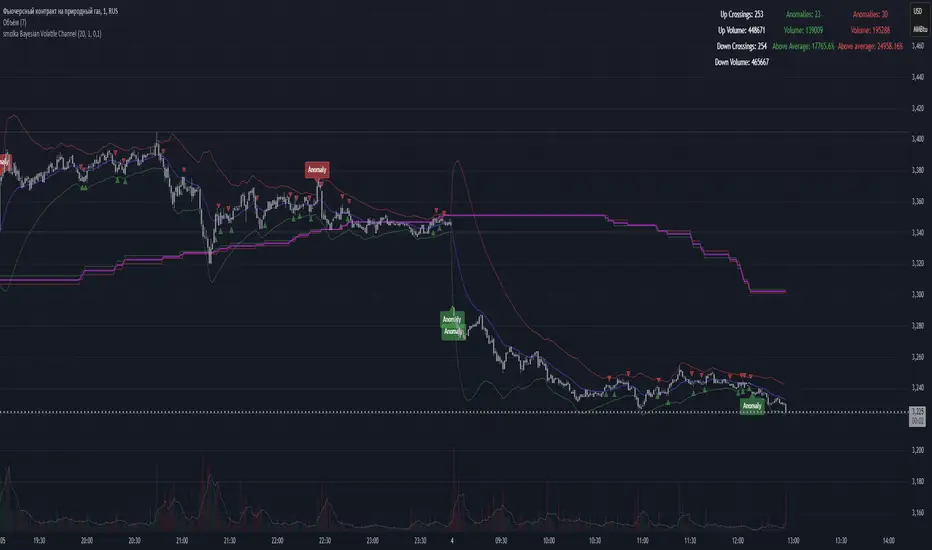
The script is a loose interpretation of Bayes' theorem, which allows calculating the probability of events given that another event related to it has occurred, the script analyzes volatility and detects anomalies in price charts using a Bayesian approach, updating the model parameters to accurately estimate market fluctuations and detect changes in trends.
How does it work?
1. The script sets the initial parameters (mean price and standard deviation), creating a "hypothesis" about the market behavior.
2. When a new price appears, the script calculates the probability of its compliance with previous expectations. If the new price differs from the forecast, the model parameters (mean and standard deviation) are updated.
3. After updating the model, the probability that the current price and volatility correspond to a normal distribution is calculated.
4. Based on the updated model, volatility channels are built (mean price ± two standard deviations). If the price goes beyond these limits, this signals a possible anomaly indicating changes in the market.
5. The moving averages in the script act as data smoothing and trend analysis, helping to identify the market direction and minimize the impact of random fluctuations. The script uses moving averages to identify uptrends and downtrends, and calculates the average between them to display the overall market balance. These moving averages make market analysis clearer and more resistant to short-term fluctuations.
******************************************************************
Описание на английском и русском языках.
Байесовский волатильный канал
Скрипт является вольной интерпретацией теоремы Байеса, которая позволяет расчитать вероятность событий при условии, что произошло связанное с ним другое событие, скрипт анализирует волатильность и обнаруживает аномалии в графиках цен, используя байесовский подход, обновляя параметры модели для точной оценки рыночных колебаний и обнаружения изменений в тенденциях.
Как это работает?
1. Скрипт устанавливает начальные параметры (среднюю цену и стандартное отклонение), создавая "гипотезу" о поведении рынка.
2. При появлении новой цены скрипт вычисляет вероятность её соответствия предыдущим ожиданиям. Если новая цена отличается от прогноза, параметры модели (среднее и стандартное отклонение) обновляются.
3. После обновления модели рассчитывается вероятность того, что текущая цена и волатильность соответствуют нормальному распределению.
4. На основе обновлённой модели строятся каналы волатильности (средняя цена ± два стандартных отклонения). Если цена выходит за эти пределы, это сигнализирует о возможной аномалии, указывающей на изменения на рынке.
5. Средние скользящие в скрипте выполняют роль сглаживания данных и анализа трендов, помогая выявить направление рынка и минимизировать влияние случайных колебаний. Скрипт использует скользящие средние для определения восходящего и нисходящего трендов, а также рассчитывает среднее значение между ними для отображения общего баланса рынка. Эти скользящие средние делают анализ рынка более чётким и устойчивым к краткосрочным флуктуациям.
Bayes
Bayesian Bias OscillatorWhat is a Bayes Estimator?
Bayesian estimation, or Bayesian inference, is a statistical method for estimating unknown parameters of a probability distribution based on observed data and prior knowledge about those parameters. At first , you will need a prior probability distribution, which is a prior belief about the distribution of the parameter that you are interested in estimating. This distribution represents your initial beliefs or knowledge about the parameter value before observing any data. Second , you need a likelihood function, which represents the probability of observing the data given different values of the parameter. This function quantifies how well different parameter values explain the observed data. Then , you will need a posterior probability distribution by combining the prior distribution and the likelihood function to obtain the posterior distribution of the parameter. The posterior distribution represents the updated belief about the parameter value after observing the data.
Bayesian Bias Oscillator
This tool calculates the Bayes bias of returns, which are directional probabilities that provide insight on the "trend" of the market or the directional bias of returns. It comes with two outputs: the default one, which is the Z-Score of the Bayes Bias, and the regular raw probability, which can be switched on in the settings of the indicator.
The Z-Score output value doesn't tell you the probability, but it does tell you how much of a standard deviation the value is from the mean. It uses both probabilities, the probability of a positive return and the probability of a negative return, which is just (1 - probability of a positive return).
The probability output value shows you the raw probability of a positive return vs. the probability of a negative return. The probability is the value of each line plotted (blue is the probability of a positive return, and purple is the probability of a negative return).
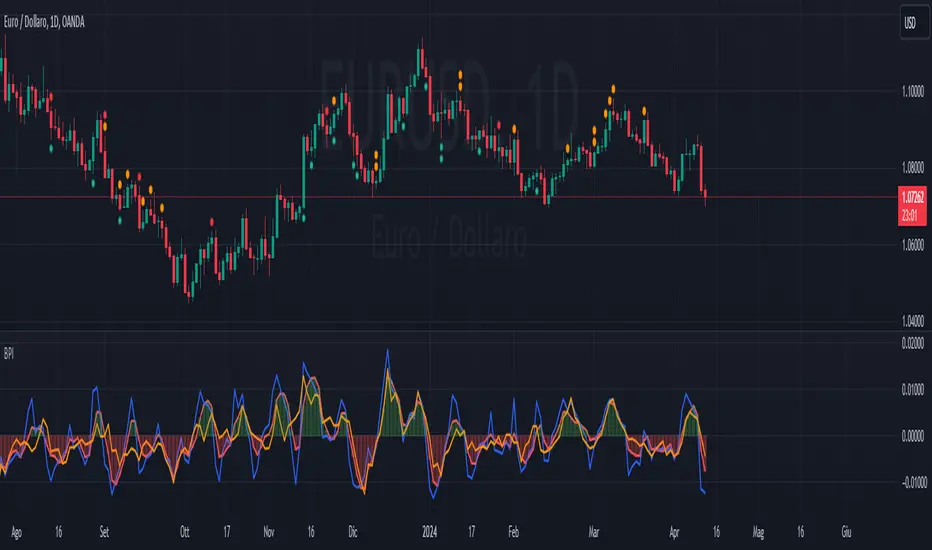
Bayesian predictive leading indicator--------- ENGLISH ---------
This is a predictive indicator ( leading indicator ) that uses Bayes' formula to calculate the conditional probability of price increases given the angular coefficient. The indicator calculates the angular coefficient and its regression and uses it to predict prices.
Bayes' theorem is a fundamental result of probability theory and is used to calculate the probability of a cause causing the verified event. In other words, for our indicator, Bayes' theorem is used to calculate the conditional probability of one event (price event in this case) with respect to another event by calculating the probabilities of the two events (past price) and the conditional probability of the second event (future price) with respect to the first event.
The red line represents the angular coefficient. The blue line represents the normalized expected price. Finally, the yellow line represents the conditional probability that the price will increase or decrease.
How to use it. In addition to the convenient histogram, which follows the angular coefficient, another practical operational application might be to go long when the blue line is above the red and yellow lines. Conversely short when the blue is below the red and yellow.
When the yellow line passes above all others, a reversal in the long direction is imminent and vice versa.
The extent of the reversal depends on how far the yellow line will be away in price from the other 2 lines.
This indicator is in its embryonic state and updates will follow to make it more graphically readable, add alerts, etc.
Stay tuned! Leave a boost and comment or write to me if you wish.
--------- ITALIANO ---------
Questo è un indicatore predittivo ( leading indicator ) che utilizza la formula di Bayes per calcolare la probabilità condizionata che il prezzo aumenti dato il coefficiente angolare. L’indicatore calcola il coefficiente angolare e la sua regressione e lo utilizza per prevedere i prezzi.
Il teorema di Bayes è un risultato fondamentale della teoria della probabilità e viene impiegato per calcolare la probabilità di una causa che ha provocato l’evento verificato. In altre parole, per il nostro indicatore, il teorema di Bayes serve per calcolare la probabilità condizionata di un evento (di prezzo in questo caso) rispetto a un altro evento, calcolando le probabilità dei due eventi (prezzo passato) e la probabilità condizionata del secondo evento (prezzo futuro) rispetto al primo.
La linea rossa rappresenta il coefficiente angolare. La linea blu rappresenta il prezzo previsto normalizzato. Infine la linea gialla rappresenta la probabilità condizionata che il prezzo aumenti o diminuisca.
Come si usa? Oltre al comodo istogramma, che segue il coefficiente angolare, un'altra applicazione operativa pratica potrebbe essere di andare long quando la linea blu è sopra la linea rossa e gialla. Viceversa short quando la blu è sotto la rossa e la gialla.
Quando la linea gialla passa sopra tutte le altre è imminente un'inversione in direzione long e viceversa.
L'entità dell'inversione dipende da quanto la linea gialla sarà distante di prezzo dalle altre 2 linee.
Questo indicatore è al suo stato embrionale e seguiranno aggiornamenti per renderlo graficamente più leggibile, aggiungere alert, ecc.
Stay tuned! Lascia un boost e commenta o scrivimi se desideri.
Bayesian BBSMA + nQQE Oscillator + Bank funds (whales detector)Three trend indicators in one. Fork of Gunslinger2005 indicator, with a fix to display the nQQE oscillator correctly and clearly, and converted to pinescript v5 (allowing to set a different timeframe and gaps).
How to use: Essentially, nQQE is a long term trend indicator which is more adequate in daily or weekly timeframe to indicate the current market cycle. Banker Fund seems better suited to indicate current local trend, although it is sensitive to relief rallies. Bayesian BBSMA is an awesome tool to visualize the buildup in bullish/bearish sentiment, and when it is more likely to get released, however it is unreliable, so it needs to be combined with other indicators.
Please show the original indicators some love:
Bayesian BBSMA:
nQQE:
L3 Banker Fund Flow Trend:
Originally mixed together by Gunslinger2005:

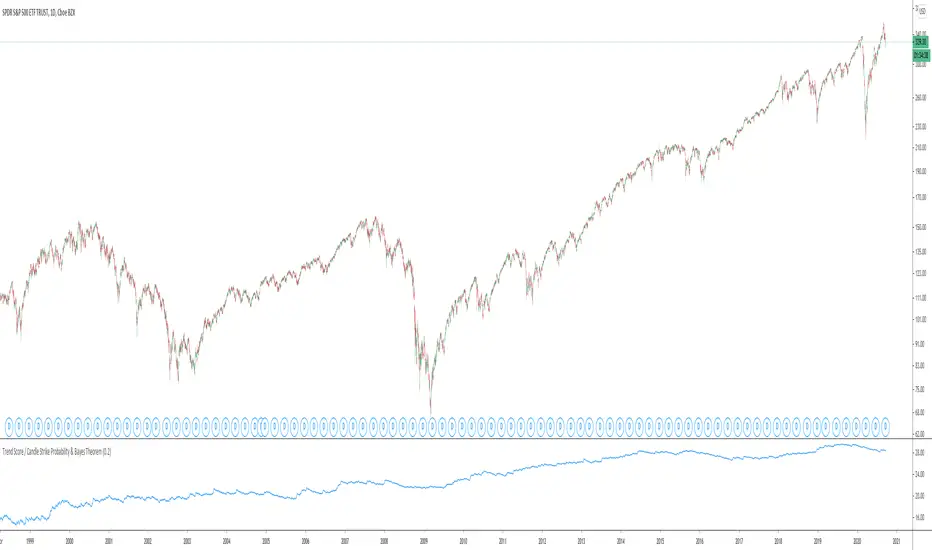
Trend Score & Bayes ProbabilityThis algo tries to tell you if the market is a trending market or a mean reversion one.
By checking how many times the correlation between the last seven candles is positive or not, and it will show the evolution of the market
Generally a trending market is one above 30 and short swing strategies will work better on this type of markets
It also shows probabilities of different candles setups like 7 Up candles in a row or the probablility of an up candle after 6 Up straight candles
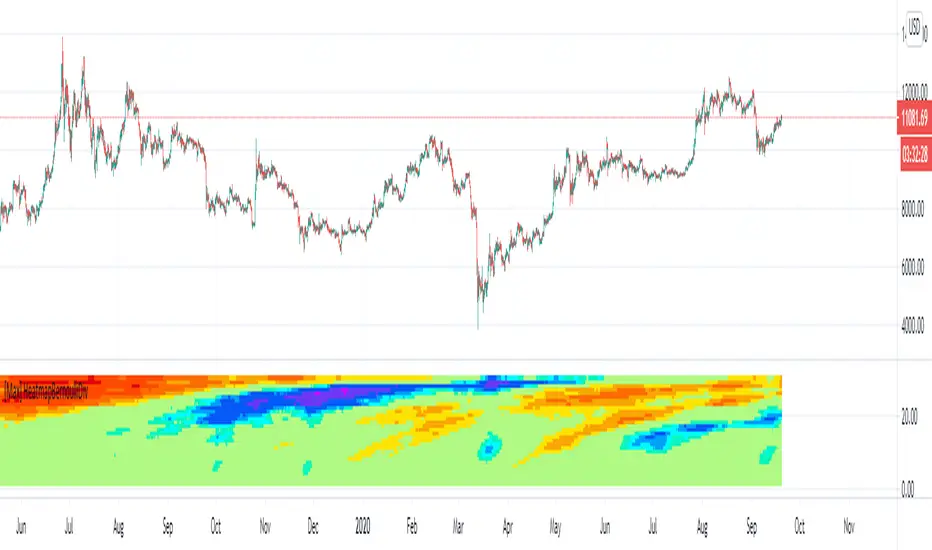
[Max] Volume Entropy Divergence HeatmapA divergence between volume and price indicator, based on custom filter function.
Each lines represent a length on wich the divergence is calculated. It goes to 60 len a the base to 2000 at the high. ( You have to decrease the timeframe if your looking on a new chart).
Colors represent a level of the oscillator who is calculated for each lengths.
What can you find, reversals, confirmation of continuation, divergences between volume and price,.. (if you find other usages I will be happy to hear it and share the code).
I recommand to be attentive to lower timeframes and confirm with higher ones and be attentive between different kind of clouds there is.
You are in charge to figure out how to use it, if you have some doubts on something you can DM me but I will not teach my way to use it.
It provide for me nice transformations, nice enough to share this indicator in private.
Big thanks to @midtownsk8rguy for the heatmap color function.
Have a nice daytrading all !
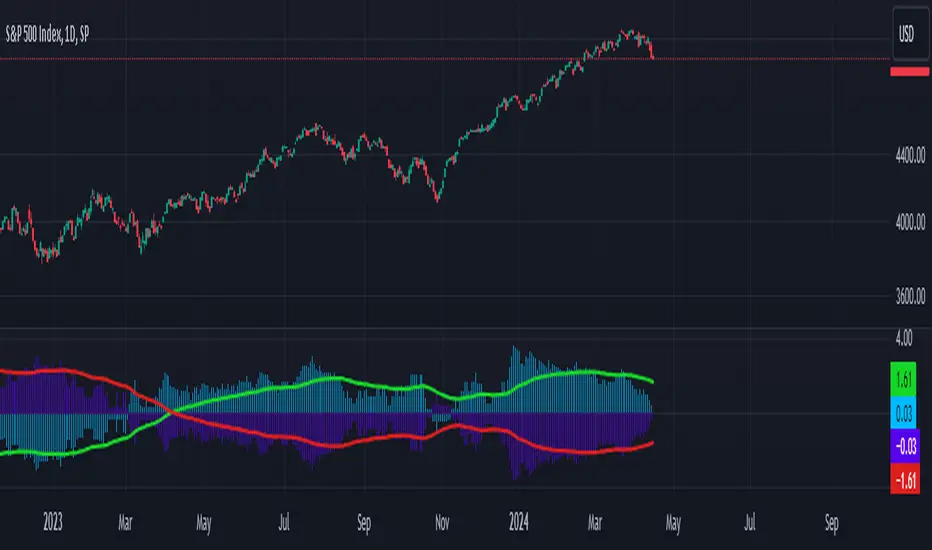
Bull/Bear Probability [Anan]Hello Friends,,,
===================================
This indicator is based on Bayes' Theorem and is fully based on probabilities.
===================================
Formula For Bayes' Theorem:
P(Bull|Bear) = P(Bear∣Bull) * P(Bull) / P(Bear)
where:
Bull and Bear are events and P is probability
P(Bull|Bear) is the posterior probability, the probability of Bull after taking into account Bear
P(Bear∣Bull) is the conditional probability or likelihood, the degree of belief in Bear given that proposition of Bull belief (Bull true)
P(Bull) is the prior probability, the probability of Bull belief
P(Bear) is the prior probability, the probability of Bear belief
===================================
The indicator output 2 trend lines and (Bull/Bear) Signal :
Bull/Bear Probability Trend :
when the price is above it = Up Trend
when the price is below it = Down Trend
Bull/Bear Probability Trend Moving Average :
when the price is above it = Up Trend
when the price is below it = Down Trend
(Bull/Bear) Signal :
when Probability Trend Moving Average crossover Probability Trend = Bull Signal
when Probability Trend Moving Average crossunder Probability Trend = Bear Signal
===================================
Disclaimer:
This script is for informational and educational purposes only.
Use of the script does not constitutes professional and/or financial advice.
You alone the sole responsibility of evaluating the script output and risks associated with the use of the script.
===================================
Thanks to my friends dgtrd because he inspired me about probability, take a look at his scripts.
===================================

Bayes Probability Index by DGTWhat is Probability?
It is a measure for calculating the chances or the possibilities of the occurrence of a random event. In simple words, it calculates the chance of the favorable outcome amongst the entire possible outcomes. Mathematically, if you want to answer what is probability, it is defined as the ratio of the number of favorable events to the total number of possible outcomes of a random events.
Is this enough? May be or may be not
Let’s consider an example,
A simple probability question may ask: "What is the probability of Amazon.com's stock price falling?"
How about if we extend our question a step further by asking: "What is the probability of AMZN stock price falling given that the Dow Jones Industrial Average (DJIA) index fell earlier?"
Now we are ready to consider conditional probability and Bayes' Theorem is where we could find answer to this question
Bayes' Theorem
Bayes' theorem, named after 18th-century British mathematician Thomas Bayes, is a mathematical formula for determining conditional probability. Conditional probability is the likelihood of an outcome occurring, based on prior knowledge of conditions or another related event occurring. Bayes' theorem provides a way to revise existing predictions or theories (update probabilities) given new or additional evidence. Bayes' theorem thus gives the probability of an event based on new information that is, or may be related, to that event
Formula For Bayes' Theorem
P(A|B) = P(B∣A) * P(A) /P(B)
= P(B∣A) * P(A) / (P(B∣A)* P(A) + P(B∣A’)* P(A’) )
where
A and B are events and P is probability
P(A|B) is the posterior probability, the probability of A after taking into account B
P(A) is the prior probability, the probability of A belief
P(A’) is the prior probability, the probability of A disbelief : P(A’)=1- P(A)
P(B) is the prior probability, the probability of B belief
P(B∣A) is the conditional probability or likelihood, the degree of belief in B given that proposition of A belief (A true)
P(B∣A’) is the conditional probability or likelihood, the degree of belief in B given that proposition of A disbelief (A false)
Bitcoin was the first-ever cryptocurrency, designed by Satoshi Nakamoto. In its likeness, all other cryptocurrencies were then created. The relationship between Bitcoin and altcoins remains something crypto analyst watch closely. This study aims to display the likelihood of bullish movement for ALTS-USDT pairs taking into consideration of bullish move probability of BTC-USDT pair
What to look for:
Percentage Value of the Conditional Probability and/or Simple Probability. When value is above %50 than bullish move is more probable, conversely when the value is below %50 bearish move is more likely
Limitations : Conditional Probability Line will be shown for daily time frame only, Simply Probability Line would be available for all time frames
Conditional Probability is calculated with the condition of BTC-USDT pair so using Conditional Probability is suggested with ALTS-USDT pairs.
Indicators aim to generate a potential signal/indication of an upcoming opportunity, but, the Indicators themselves do not guarantee the future movement of a given financial instrument, and are most useful when used in combination with other techniques.
Trading success is all about following your trading strategy and the indicators should fit within your trading strategy, and not to be traded upon solely
Disclaimer : The script is for informational and educational purposes only. Use of the script does not constitutes professional and/or financial advice. You alone the sole responsibility of evaluating the script output and risks associated with the use of the script. In exchange for using the script, you agree not to hold dgtrd TradingView user liable for any possible claim for damages arising from any decision you make based on use of the script
