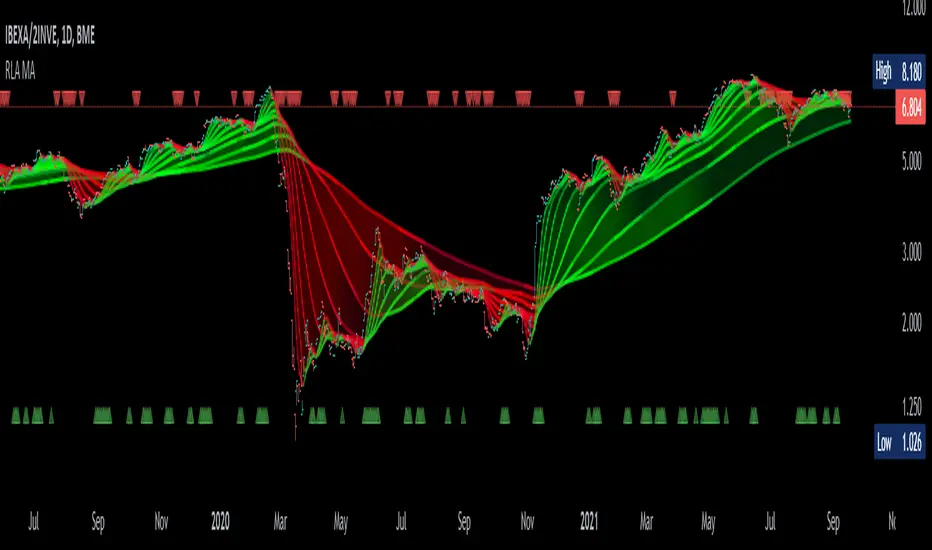
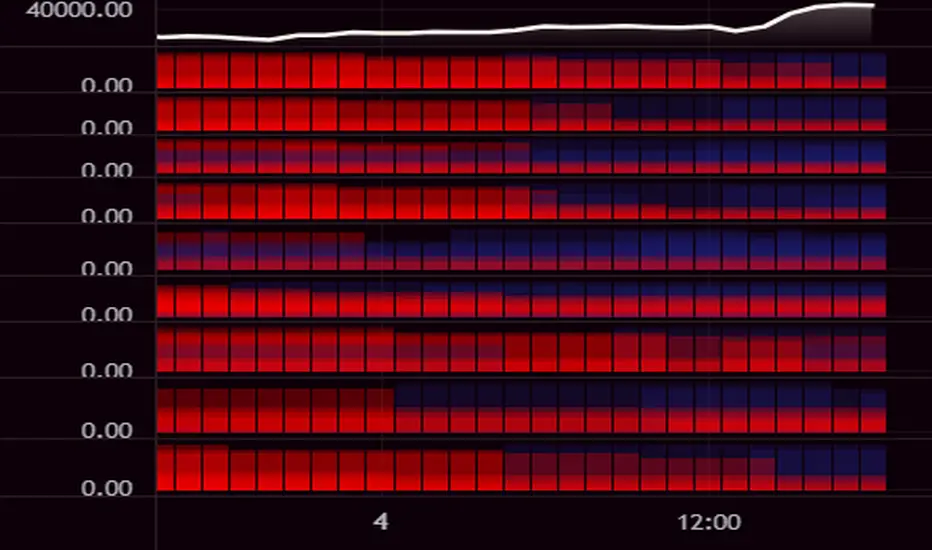
Williams Alligator Trend Filter HeatmapHello I've decided that the alligator lines can be used to find a trend. This script expands on that and checks 10 different multipliers to see trend over the long term and have 10 values. Those 10 values each give a color to one of the 10 lines in turn giving this Fire like plotting. I personaly use this to see if there is fear (red) in the markets or greed (blue), plotted 9 different crypto coins on the chart and have 4 columns in my setup to see the values on different timeframes. In the chart preview this is 1H,30M,10M,1M to see current environment. The colors use alot of data to generate especialy the bottom part, that colors based on a very long time zone.
Bill Williams Indicators
Williams Alligator Trend FilterI've edited the normal Bill Williams Alligator indicator to have a color fill that indicates the trend. There is a percentage range filter which checks if the 2 outer lines are enough far away from eachother to indicate a trend. The indicator also checks if the lines are below or above eachother in the right order as a last check to confirm Trend

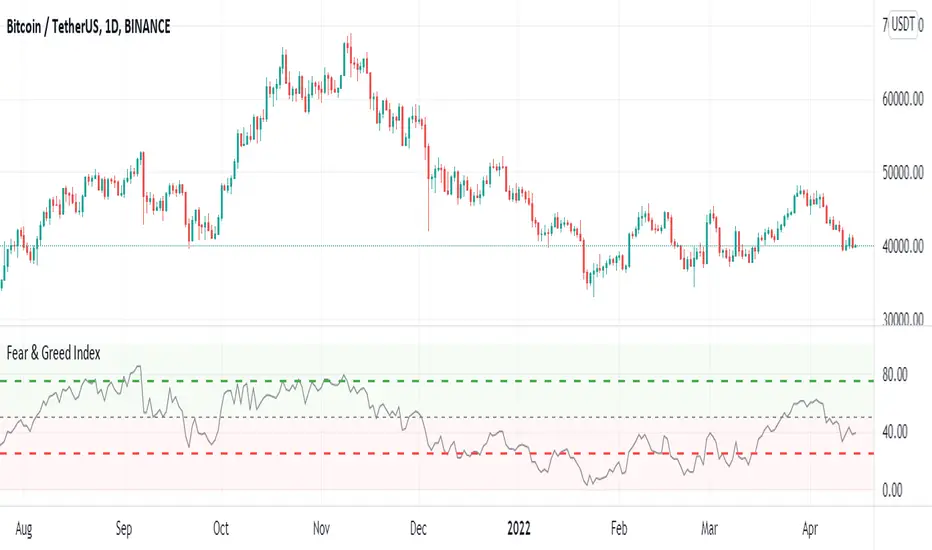
Crypto Fear & Greed IndexCrypto Fear & Greed Index
Crypto Fear & Greed Index is a metric to gauge sentiment levels in the crypto market.
The index starts from 0 to 100, with 0 meaning “Extreme Fear” (a potential bottom signal as investors are overly worried), and 100 meaning “Extreme Greed” (a potential top signal as investors are overly bullish).
Why Measure Fear and Greed?
In most markets, participants tend to be emotional with their behavior. Market participants often get overly greedy and FOMO when prices are on a euphoric rise, whilst they also tend to be overly fearful when prices are down and irrationally selling their positions at a loss.
Using the Crypto Fear and Greed Index
The Crypto Fear and Greed Index is commonly used to time entry into the market. As such, the Index is seen as less of an investment research tool and more of a market-timing tool. As stated by Warren Buffet, “Be fearful when others are greedy, and greedy when others are fearful.”
Calculation of the Crypto Fear and Greed Index
The Crypto Fear and Greed Index is based on three different factors – each factor is gauged from 0 to 100 and equally weighted to generate the index value.
The three factors are:
1. Stable coin flows
If there is a market sell-off and investors are expecting the value of their crypto investment to decline, they may rotate into stable coins as a safe haven.
As such, we look at the general trend of stable coins volume and activity to measure if the market is greedy or fearful.
2. Market Momentum
The performance of the top 18 coins relative to its 30-day average. A greater relative performance indicates greed and vice versa.
3. Top 18 Coins Price Strength
The number of coins of the top 18 coins hitting 90-days highs relative to those hitting 90-days lows. A greater number of coins hitting 90-days highs versus 90-days lows indicates greed and vice versa.
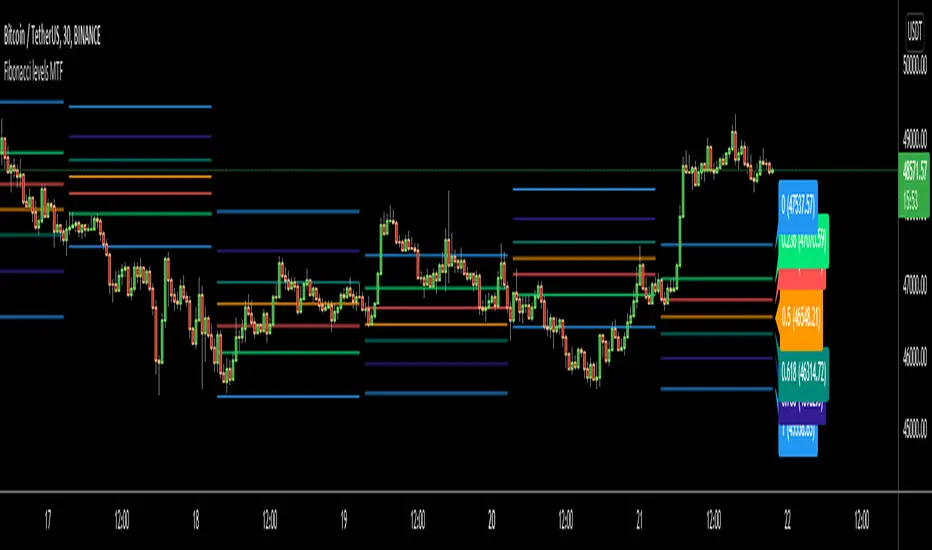
Fibonacci levels MTFHello All,
I got some requests for a script that shows Fibonacci Levels of Higher Time Frame Candles. so I made/published this script. I hope it would be useful for you.
Options:
You can set Higher Time Frame, by default it's 1 Day.
Optionally it can use Current or Last Candle of higher time frame to calculate/show its Fibonacci Levels.
It can show higher time frame candles at the background optionally. You can change its colors.
You can enable/disable/change each Fibonacci levels and their colors.
You can enable/disable Fibonacci Labels that is shown at the right ride and see only Fibonacci lines/levels
example, Fibonacci levels with higher time frame candles:
P.S. if you have ideas to improve this script, drop a comment under the script please
Enjoy!
[JL] How Many Signals last N barsGot this idea after I found Multiple Indicators Screener from QuantNomad.
This script learnt some codes from QuantNomad's great script. Thanks to him.
------------------------------------------------------------------------------------------------------------------------------------------------------------------------
This table show how many signals happened during the last N bars.
I only take care Forex, so this table only has 28 symbols. Feel free to change it.
Calculate the following signals:
RSI cross over/under 50
Short Moving average cross over/under long moving average
Stochastic k cross over/under d
MACD hist cross over/under 0
Williams Fractals: Up and Down fractals happened.
The concept is simple: Range period will always happen more cross signals than the trend period.
When the counter is less than median of all symbols, will be set green color. So more green mean more chance to be trend.

Smart Swing Strategy for StockSpecial indicator for stock but you can try another instrument.
Trend determination and buy/sell signals are using the Alligator system from Bill Williams .
To get maximum profit, the system uses the trailing stop technique using Average True Range (ATR) with 4 moving average options (RMA, SMA , EMA , WMA ).
Please leave comments if any opinions.
Disclaimer
The content is in any event provided with the intention of being for general circulation and availability only. As such it is not intended to and does not form part of any offer or recommendation directed at you specifically, or have any regard to your investment objectives, financial situation, or needs of yourself or any other specific person. Before committing to a trade or investment, please seek advice from financial or other professional advisers regarding the suitability of the trade for you. If you do not wish to seek such financial advice, please consider carefully whether the product is suitable for you as you alone remain responsible for your trading gains and losses.


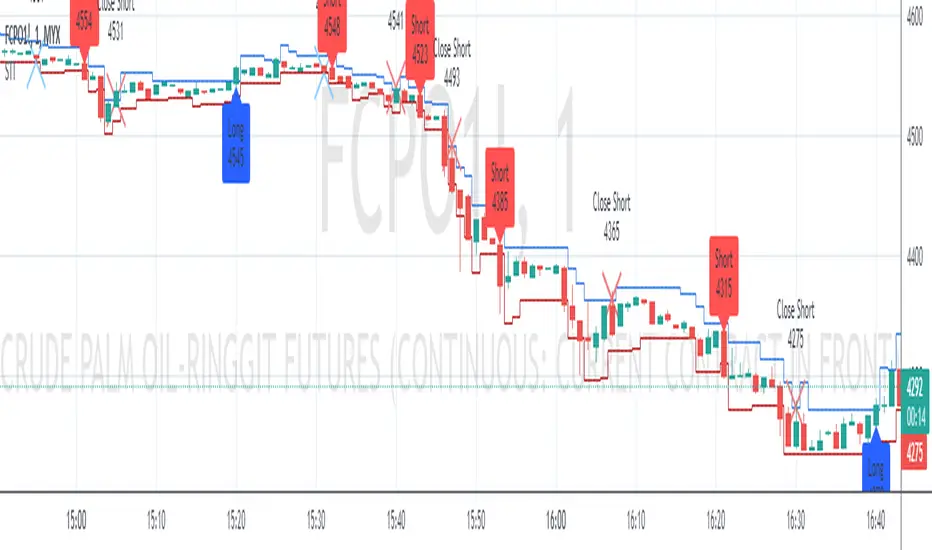
Swing Indicator (Tune for FCPO)Special indicator for FCPO (Crude Palm Oil Futures - Bursa Malaysia Derivative) traders but you can try another instrument.
Trend determination and buy/sell signals are using the Alligator system from Bill Williams.
To get maximum profit, the system uses the trailing stop technique using Average True Range (ATR) with 4 moving average options (RMA, SMA, EMA, WMA).
Please leave comments if any opinions.
Disclaimer
The content is in any event provided with the intention of being for general circulation and availability only. As such it is not intended to and does not form part of any offer or recommendation directed at you specifically, or have any regard to your investment objectives, financial situation, or needs of yourself or any other specific person. Before committing to a trade or investment, please seek advice from financial or other professional advisers regarding the suitability of the trade for you. If you do not wish to seek such financial advice, please consider carefully whether the product is suitable for you as you alone remain responsible for your trading gains and losses.
SMART4TRADER - Bill Williams Market Facilitation IndexThis indicator is written by 🔴 correct formula and for the correctness of the data is used by the Security function for the correct data request name from the open schedule, and not as usual with a similar ticker.
1️⃣ volume grows and MFI grows ➖ Green bar occurs when a growing volume and market dynamics. It signals us forward (down or up), that is, the number of transactions in the market is growing and they move the market in one specific side. Usually this bar is useless to enter the market, as the movement is already going, but it is very useful to determine the correctness of our entrance. In other words, if we are already in the market and see "green light" when a market hiking, for example, down, then we can be confident in the correctness of our entrance.
2️⃣ volume decreases and MFI decreases - Fuchsia (pink) ➖ "fading" bar appears in case of falling interest in the market in players, that is, the number of transactions (teak volume) decreases, and the market freezes (motion slows down). In trade, this bar is practically useless, although it often appears on the top of the first wave of Elliot.
3️⃣ volume decreases, and MFI grows - gray ➖ "fake" bar manifests when the activity of the market is growing with a decrease in volumes. This is an ambiguous bar and no sense from him. It is just necessary to understand that the market is moving, despite the decline in the activity of participants.
4️⃣ volume is growing, and MFI is reduced - blue ➖ "squatting" bar, perhaps the most interesting bar, since all movements end in a squatting bar, which may be, but not necessarily at the very bottom (vertex), and maybe near (one two bars). As stated in the book of Bill Williams, all the main trends end with the "squat" bar, which is among one of the three bars in the top or base.
--------------------------------
Этот индикатор написано по 🔴ПРАВИЛЬНОЙ ФОРМУЛЕ🔴 и для корректности данных используется функция SECURITY для правильного запроса данных имено с открытого графика, а не как обычно с похожего тикера.
1️⃣ Объем растет и MFI растет ➖ зеленый бар возникает при растущем объеме и динамике рынка. Он сигнализирует нам движение вперед (вниз или вверх), то есть количество сделок на рынке растет и они двигают рынок в одну определенную сторону. Обычно этот бар бесполезен для входа в рынок, так как движение уже идет, но он очень полезен для определения правильности нашего входа. Иными словами, если мы уже в рынке и видим «зеленый свет» при походе рынка, например, вниз, то мы можем быть уверенным в правильности нашего входа.
2️⃣ Объем снижается и MFI снижается – фуксия (розовый) ➖ «Увядающий» бар появляется в случае падения интереса к рынку у игроков, то есть количество сделок (тиковый объем) уменьшается, и рынок замирает (движение замедляется). В торговле этот бар практически бесполезен, хотя он часто появляется на вершине первой волны Эллиота.
3️⃣ Объем снижается, а MFI растет – серый ➖ «Фальшивый» бар проявляется, когда активность рынка растет при снижении объемов. Это неоднозначный бар и толку от него особо никакого нет. Просто надо понимать, что рынок движется, несмотря на снижение активности участников.
4️⃣ Объем растет, а MFI снижается – синий ➖ «Приседающий» бар, пожалуй, самый интересный бар, так как все движения заканчиваются приседающим баром, который может быть, но не обязательно в самом дне (вершине), а может быть рядом (один-два бара). Как говорится в книге Билла Вильямса, все основные тренды заканчиваются «приседающим» баром, который находится среди одного из трех баров в вершине или основании.

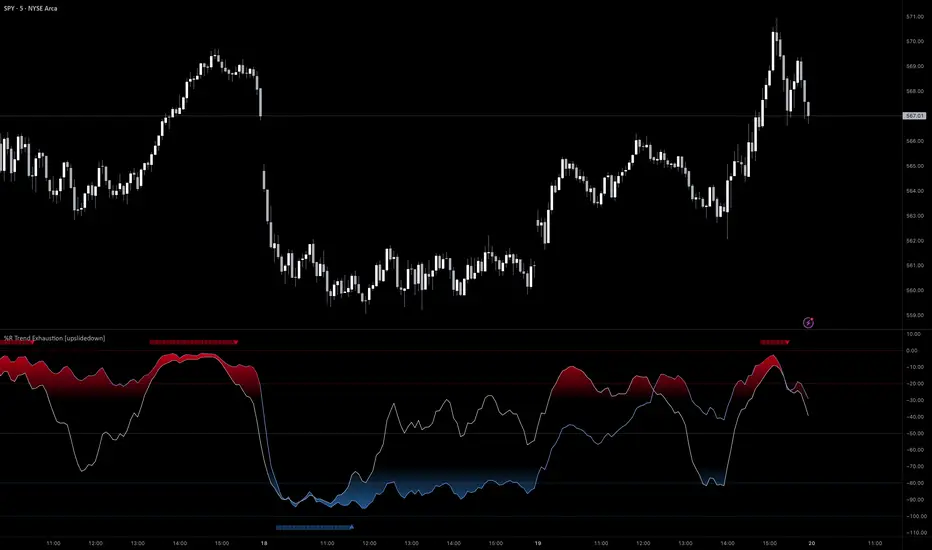
%R Trend Exhaustion [upslidedown]I love Williams %R! This indicator mixes two %R periods... a standard %R with a longer period %R. The longer period of 112 has interesting results for trend following strategies in the crypto market through backtesting.
Alone these are fairly ordinary but together they provide a very interesting trend exhaustion/reversal system while filtering out some noise. I have highlighted key areas of interest with filled boxes. An "area of interest" is when there is confluence between the short and long period %R values along with being overbought or oversold. Once there is a break in the overbought or oversold trend, an arrow will print.
This is one of my odder ideas that appears to have some merit and detects interesting tops or bottoms (or confirms a trend reversal) so I'm publicly publishing for the community to find. If you find this useful please reach out and let me know how you use it as it's fairly unique... and thus different than anything I've ever seen or used.
Argo II - (alerts for 3commas composite bots) - publicThis script lets users create BUY/SELL alerts for 3commas composite bots (1 alert = 12 pairs) in a simple way, based on a built in set of indicators that can be tweaked to work together or alone through the study settings.
There is a version of this script for single pair bots, with slightly more features here .
If the user choses to create both BUY and SELL signals from the study settings, the (1) alert created will send both BUY and SELL signals for all 12 pairs selected. At this stage, the script forces the user to select 12 pairs in the study settings. If less pairs are inserted, it will not work. Also, the script will only send alerts for the pairs selected in the study settings, not for the current chart (if different).
How to use:
- Add the script to the current chart
- Open the study settings , insert bot details and select 12 pairs. You should write the pairs manually, using the format BTC , ADA, ETH, etc. They MUST be in capital letters or 3commas will not recognize them.
- Still in the study settings, tweak the deal start/close conditions from various indicators until happy. The study will plot the entry / exit points below the current chart (1 = buy, 2 = sell)
- Make sure your strategy works for all the pairs you have selected, simply by checking each chart with the same study settings
- When happy, right click on the "..." next to the study name, then "Add alert'".
- Under "Condition", on the second line, chose "Any alert () function call". Add the webhook from 3commas, give it a name, and "create".
That's it.
Notes:
- If you insert coins that are not available for the quote currency and exchange of your choosing, the script will not work and return an error.
- Make sure you run tests with paper trading or dummy bots (i.e without actual bot ID) to ensure your alerts trigger as intended on all coins.
- If alerts trigger too much (i.e they all trigger at the same time for all coins), Trading View will stop the alert. So probably not ideal for a scalping bot. It could also be the sign the script doesn't work as intended.
- The script is a bit slow on my side. I am a beginner in pinescript, so if anyone knows how to simplify it, please let me know.
- if anyone knows how to tell the script to function with less than 12 pairs (when not filling the 12 fields in the setting), please also let me know :)
EneX SignalEneX is signal that give recommendation signals for entry and exit on spot market. This indicators not suitable for leverage trading in futures market.
EneX signal consider several indicators and has entry and exit rules.
EneX signal is suitable for investors who believe in trend following strategy (disclaimer on).
This script composed by Yohan Naftali for educational purpose only. Reader who will use this signal must do own research.
Indicator and Plot Involved
1. Williams Fractals with default periods = 2
2. William Alligator Indicators with default simple moving average 8, 13, and 21
3. Exponential Moving Averages with default value EMA 50, 100, and 200
4. Relative Strength Index with default overbought level = 80 and oversold level = 20
5. Williams Fractals are joined to create support and resistance line and fill area between support and resistance lines.
Entry signal conditions
1. Entry on Weakness when bullish fractal appear on n/2 period
2. Entry when price break resistance line
All entry condition must above EMA and alligator signal and not in overbought RSI
Exit signal conditions
1. Lowest price is below Exponential Moving Average
2. Lowest price is below William alligator lines
You can easily find entry and exit points by using Entry (E), Exit(X) signals
How to use
1. Monitor chart and wait until E or X signals
2. Entry if Entry Signal (E) appear (green colored label)
3. Exit if Exit Signal (X) appear (red colored label)
4. Change indicators setting when necessary
Best Practice
1. Entry only when entry signal (E) appear
2. Never entry when price below William alligator signal
3. Exit when exit signal (X) appear
4. Not exit when exit signal appear when you believe or you have information that price will be rebound
5. Exit if you believe that current price meet your target price
6. Always wise when use EneX signals
Disclaimer
Do your own research and consider fundamental price of asset.
The indicators provided on this script is for educational purposes only.
Author does not offer advisory or brokerage services, nor does it recommend or advise users to buy or sell particular stocks or securities.
Please examined script and give feedback for further improvement.

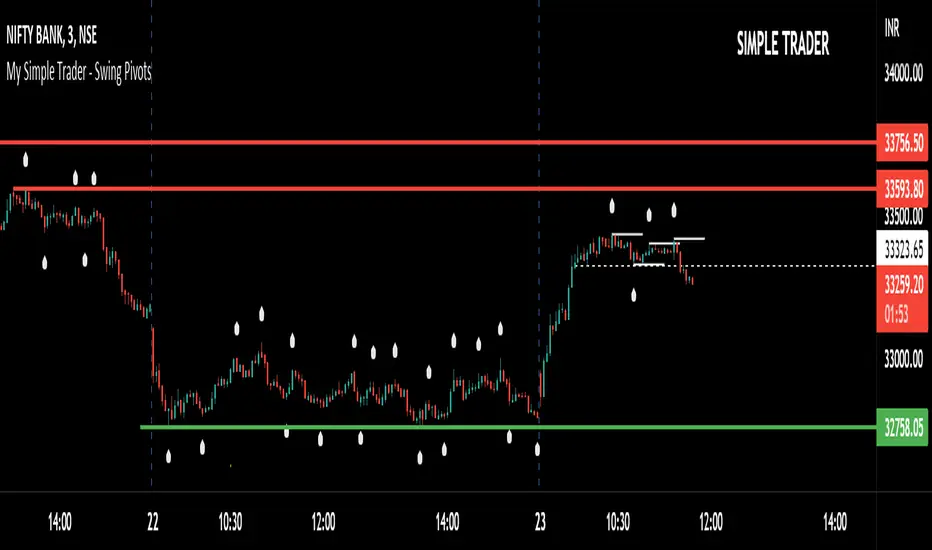
Simple Trader - Swing PivotsSimple Trader - Swing Pivots.
Note: Do not use this indicator as buy/sell signals.
I'm using this indicator to see the visible reversal points in chart.
I use 5 candles preceding and 5 candles following in 3 mins chart to analyze the trend and momentum.
I use 2 candles preceding and 2 candles following in 30 mins chart to analyze the trend and momentum.
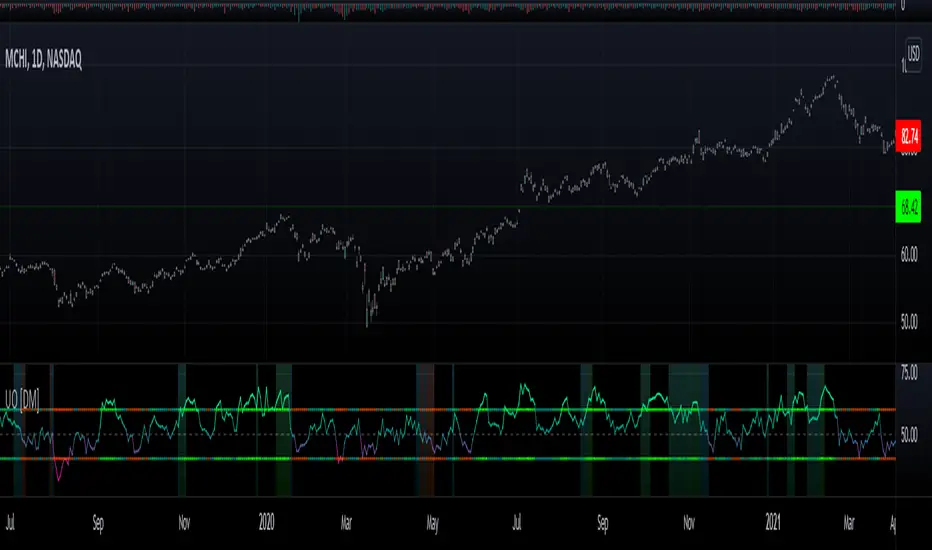
Willians Ultimate Oscillator [DM]Hello colleagues
I share the Williams Ultimate Oscillator
You can select betwen:
1.Average signal of 9 lengths (3 X UO).
2. Three independent signals UO.
You can also customize the oversold and oversold bands.
Some alerts were added.
The gradient colors of the background warn us of a squeeze in the movement of the indicator.
If there is something that can be improved (it is certain that it is) please leave it in comments.
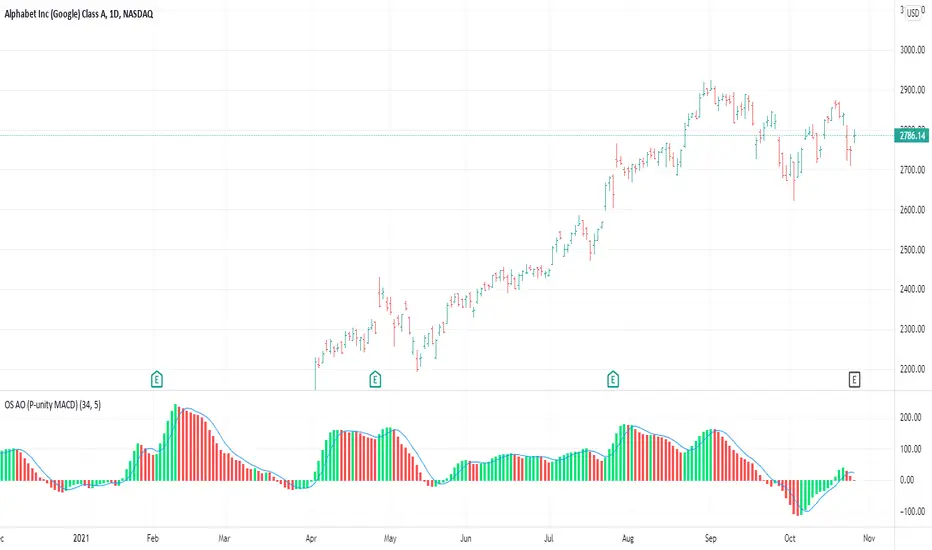
OS AO (P-unity MACD)This is both the Awesome Oscillator (AO) as described in New Trading Dimensions ( NTD , book by Bill Williams ), and the Profitunity MACD described in the first edition of Trading Chaos.
The calculation for both is the same. In this case I added the 5 day SMA which is the blue line. The difference between the blue line and the AO is the AC which is also described in NTD and is usually plotted in a different indicator (AC).
This is the base for the following signals:
Zone Bar
2nd Wise Man
The signals are triggered and shown on the main chart screen through the use of OS Alligator . This indicator (AO) provides further insight in analyzing those signals by reading the AO, its current position and evolution directly.
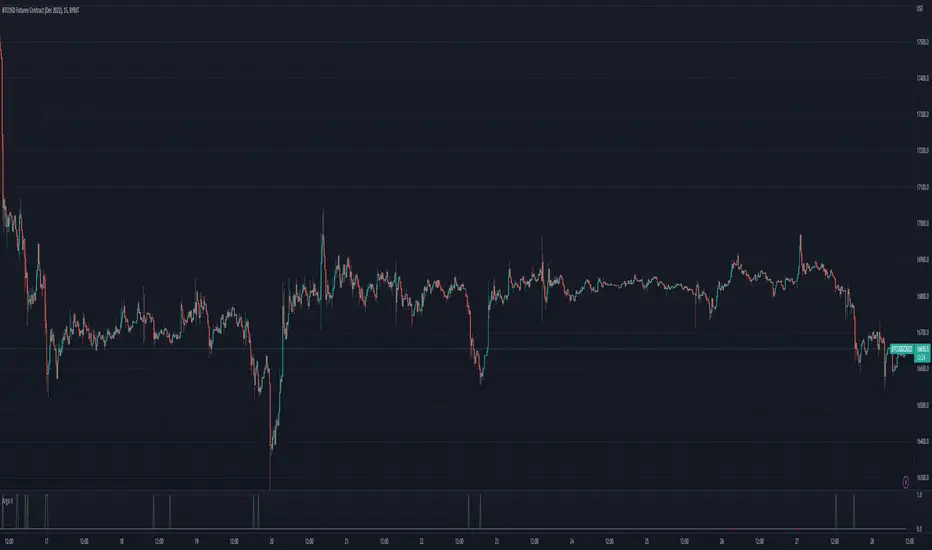
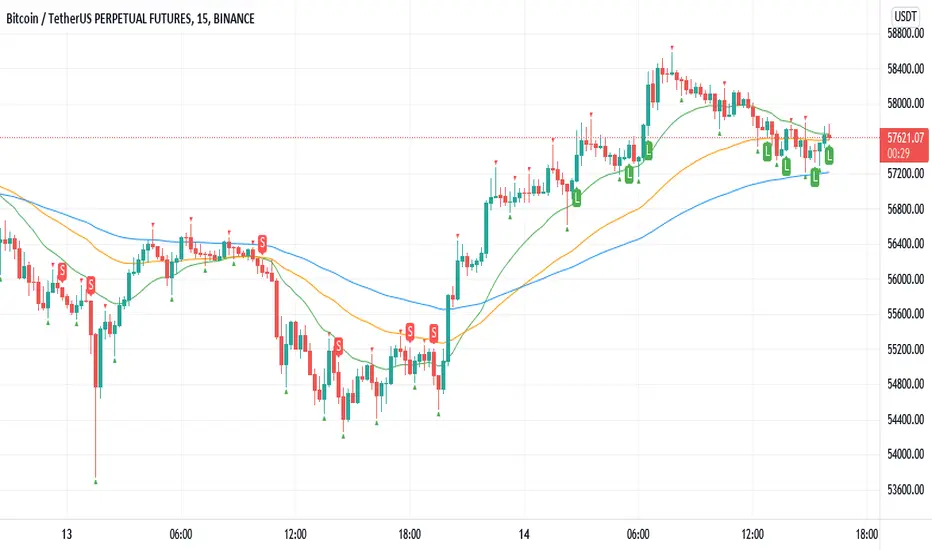
Williams Fractals BUY/SELL signals indicatorThis indicator made with using Williams Fractals, 20 50 100 Moving Averages and Relative Strength Index. You can easily find entry points by using Long (L), Short (S) signals.
This is a 15min scalping strategy for BTC:USDT Perpetual pair. For use different pairs or TFs you may need to change settings.
How to use
****************
When flashing Long (L) or Short (S) signal you should wait until the candle closing for the confirmation.
After that candle closed with the signal, you can enter a trade in next candle opening.
Your SL should be 3.1% from etnry and TP should be 0.5% from entry for best results. (You can use Long Position / Short Position tool in Prediction and Measurement Tools in drawing pannel to calculate this. This settings only for BTC:USDT Perp 15 min TF. For other TFs or Pairs settings may vary. You can easily change these settings and backtest your own.)
After entering a trade you can be ignored next signals until close the trade.
To learn more about this strategy, please try the "Williams Fractals Strategy" I coded. Thank you!
Rainbow FractalsThis Indicator uses the Bill Williams Fractals with coloring based on the Peak High/Low of the most recent RSI Value.
This helps quickly identify RSI bearish and bullish divergence without having a RSI lower indicator loaded onto the chart.
When the RSI is between 40 and 60 no fractals are posted. Lighter colored fractals are closer to a RSI value of 50 and darker fractals or further away from a RSI value of 50.

Argo I (alerts for 3commas single bots)This script lets users create BUY/SELL alerts for 3commas single bots in a simple way, based on a built in set of indicators that can be tweaked to work together or separately through the study settings. Indicators include Bollinger Bands, Williams %R, RSI, EMA, SMA , Market Cipher, Inverse Fisher Transform.
If the user choses to create both BUY and SELL signals from the study settings, the alert created will send both BUY and SELL signals for the selected pair. Note the script will only send alerts for the pair selected in the study settings, not for the current chart (if different).
How to use:
- Add the script to the current chart
- Open the study settings , insert bot details. Pairs MUST be in capital letters or 3commas will not recognize them.
- Still in the study settings, tweak the deal start/close conditions from various indicators until happy. The study will plot the entry / exit points below the current chart (1 = buy, 2 = sell)
- Ideally, test the settings with a backtesting script. The present script is compatible with the Trading Parrot's backtester.
- When happy, right click on the "..." next to the study name, then "Add alert'".
- Under "Condition", on the second line, chose "Any alert () function call". Add the webhook from 3commas, give it a name, and "create".
Happy tweaking!

Hotch v1.02 RSI+Fractals/VWAP Bands/Smoothed Moving Average. In this script the RSI is used the limit number of displayed fractals to only those fractals that are triggered in the RSI Overbought and Oversold areas. This helps keep the chart cleaner looking when combined with other indicators so other icons that are plotted above and below candles are not covered up.
For example if the RSI drops below 30 the next fractal would be displayed.
If the RSI stays below 30 each fractal would be displayed.
If the RSI dips below 30 and returns above 30 before there is a fractal is displayed, the next valid fractal would still be displayed.
With optimization of the RSI values this indicator can be used in confluence with the included VWAP bands and Moving average to find trend reversal entry points for trades. Also recommended is to use a divergence identifying lower indicator as a secondary confirmation of trade entry.
Example of a potential long entry using the displayed chart.
1) RSI under 30
2) Price was recently outside of your chosen VWAP multiple.
3) a fractal was triggered.
Additionaly:
4) Use other indicators or other confluences for a stronger trade signal.
5) Use your preferred method of determining entry price stop loss and take profit.
NOTE: Fractals normally paint two bars behind the current bar. In this code, with the combination of the RSI and Fractal Trigger, the fractal paints an icon on the current bar.

Fx Crusher Scalping Indicator V1█ OVERVIEW
Scalping Indicator with Buy and Sell Signals for the 15 min and 5 min Chart. Works on all assets (Crypto, Forex, Stocks, Indices, Commodities and Metals)
Only use in trending markets. Signals in a ranging market are useless.
This Scalping Indicator is different from others because most of the Buy/ Sell signals actually make sense. No counter trend trading and most signals can be very profitable when used right.The single most important goal was to have an indicator that shows signals with a big possible risk reward ratio. Most false signals are filtered out. The Fx Crusher Scalping Indicator is not perfect but it is amazing. You can customize the indicator to get the highest signal quality.
█ HOW DOES IT WORK?
The indicator determines the trend direction by using 3 different smoothed moving averages. A green background shows an uptrend and a red background shows a downtrend.
The strength of the trend is determined by the slope of the individual SMMAs. You can set the slope of every single SMMA for buys and sells individually.
The indicator only shows signals when there is a clear trend on the current timeframe.
Entry signals are generated by a combination of Williams fractals, SMMA crossover, trend angle and RSI condition.
█ HOW TO USE?
Draw Support & Resistance lines on the 4H Chart
Determine the overall trend on the 1H Timeframe
Go to the 15 min or 5 min Time Frame and have a look at the signals
Adjust the slope of every single SMMA in 0.01 steps until the signals look good
Adjust the RSI settings for overbought and oversold condition if necessary
Only enter a trade after the candle that prints a signal is closed.
Only take buy positions when all SMMAs are going up and don’t touch each other
Only take sell positions when all SMMAs are going down and don’t touch each other
Only use this Scalping Indicator with proper Risk management and a risk reward ratio of around 1:2.
Trail your stop to get the most pips out of the signals. Very often the indicator shows signals right before major moves.
█ ADDITIONAL INFO
Be careful with buy signals when the market on the higher timeframe (4H and 1H) is in a downtrend and vice versa.
You can make the most profit out of this Indicator when you enter with 2 positions. A quick scalp and a runner. Because there's a lot of signals with huge risk reward ratios but also some unprofitable signals . Therefore make sure you make the best out of the good signals and apply proper risk management to limit losses with bad signals. Stop loss placement according to market structure.
Multiple Signals in a row can show a high probability of a very strong upcoming move. Monitor your trades and secure partials to make the best out of it.
You can select how many signals it is going to show once trend conditions are met. Please be aware that the longer a trend goes, the higher is the probability of a reversal. Therefore the first few signals after all conditions are met are most likely the most profitable.
By setting the slope of the slow SMMA correctly you can filter out most signals in a ranging market.
█ DISCLAIMER
This is not financial advice. I do everything I can to provide the most accurate buy and sell signals for scalping but past results are no guarantee for future performance.

Inverse Fisher Transform on Williams %RInverse Fisher Transform On Williams %R
Since Williams R indicator produces negative values, I preferred to add 50 instead of subtracting 50.
It produces values between 0.5 and -0.5.
Generates clear buy and sell signals.
Williams %R determines overbought and oversold levels.
You can see more softly.

HPH's FractalTradesThis indicator is based on some dark fractal magic.
Not really, it's inspired by Vladimir Poltoratskiy and basically just waits for the price to go higher or lower than a previous fractal. If that's the case and all the additional settings allow the trade to take place, it is entered with the stop loss at the last opposite fractal of were it was entered (so if we enter a trade because the price went higher than the last up fractal, the sl is at the last down fractal).
The trades are visualised with a stop loss and 3 take profits levels (at a 1:1, 2,1:1 and 4:1 risk/reward ratio). The stop loss will trail once a certain take profit level is reached. Enjoy!
The settings:
LiveVersion : If ticked it will use close for stop losses and take profits. If unticked high and low will be used. Neither is accurate when backtesting as there is no intrabar data...
CancelEarly : Swings trade in the opposite direction when an opposite signal is received. If unticked the trade will continue until a tp or sl is hit.
ShowStats : Show a table in the top right displaying how many times the stop losses or take profits got hit.
FractalPeriods : Number of bars that are required for a fractal. E.g. if it's 2, 2 bars need to be lower on the left and right of a candle for it to print an up fractal.
MinFractalDiv : If this is bigger than 0, it will not allow new fractals to print unless they are at least a percentage based amount bigger than the last one. So this can be used to filter out fractals that are in the same range. Bigger value = more aggressive filtering!
TicksOnFractal : Tick based offset to add onto the fractals to enter trades. E.g. if it's 5 and the price goes above an up fractal, it needs to go up 5 more ticks to enter a trade.
UseFilter, FilterMultMin and FilterMultMax : If ticked, trades are limited to the once in the specified range (distance of the stop loss). E.g. if FilterMultMax is 0.05, the stop loss can not be bigger than 5% of the assets price for the trade to take place.

Alma Moving Average Ribbon Reverse Length [DM]Greetings Colleagues
Following some recommendations and ideas I share this moving average, put all of them together
The length calculation is automatic there is only one input.
The length is inverse so it will wrap from the longest reference point, hence using phi
Moving averages will wrap around the price.
I've also added gradient color to plots and fill plots
There is an alert selector in case you are interested in a particular crossing, "remember that the order is reversed".
There is an alert visual plotshapes with offset signal.
Finally, after spending a few hours with the Williams alligator moving averages I found nothing special, but I added the individual offset adjustment for each moving average in case someone comes up with something.
Enjoy”
Some references about alma by "tradingview pinecoders"
What to look for
The Arnaud Legoux Moving Average has three elements to it:
Window: This element is the period. By default, the window is set to 9 periods, but it can be customized to fit any trading style.
Offset: This element is the Gaussian that is applied to the combo line and can be aligned to the current price. It’s default is set to 0.85, but by setting it to 1, you can make it align fully to the current price (similar to how an Exponential Moving Average (EMA) with a setting of 0 is like a Simple Moving Average (SMA)). 0.85 is what is recommended, however, you can customize it like with the window element.
Sigma: This element is a standard deviation that is applied to the combo line in order for it to appear more sharp. The default is set to 6 and it is not recommended to change the setting. The value of 6 is inspired by the Six Sigma process.
www.tradingview.com