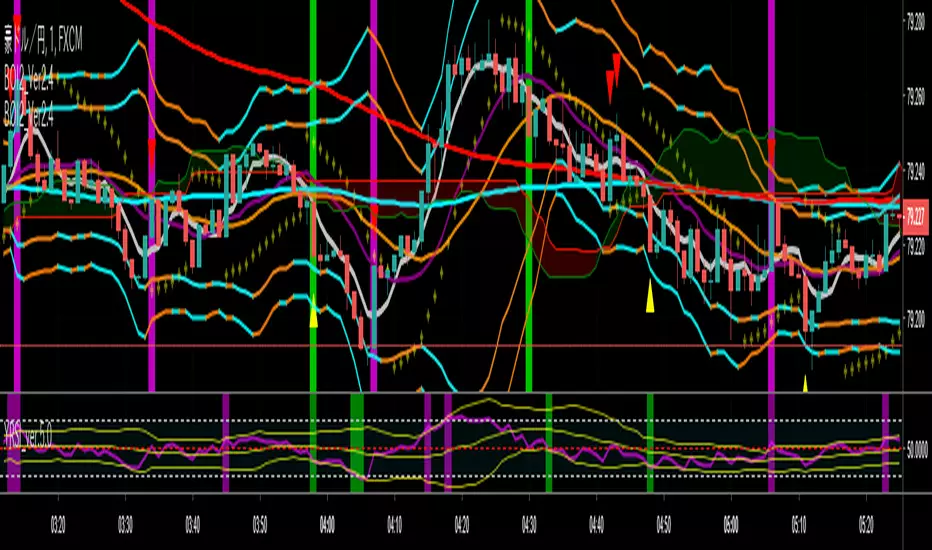
Binary
SlingerMust be added an Ichimoku Clound with the following entries
Conversion Line Periods __4
Base Line Periods _______ 26
Lagging Span 2 Periods___ 52
Displacement __________ 26
Turn off from chart
-Conversion Line
-Base Lina
-Lagging Span
Must add 1 EMA 25
Instructions, USE FOR BINARY AT TRENDING CHARTS
5MIN
BUY
Price must be OVER Ichimoku Clound, EMA 25 and pulled back to the GREEN lines
SELL
Price must be BELOW Ichimoku Cloud, EMA 25 and pulled back to the GREEN lines
ENTRY
As it comes back moving up or down after touching the green line(s)
I may update the script later and add all at the same so you don't have to add the EMA 25 and the Ichimiku Cloud


NADEX Binary OptionsAlright guys, I finally nailed NADEX Binary options!
You can use my indicator for any timeframe.
I use primarily it for 5 minutes NADEX binary options.
How do you use it?
============================
1. Watch out for a gray arrow on one minute chart, that tells you that there might be a chance of reversal.
2. Once you get a gray arrow on the chart, wait for red or green arrows depending on trends.
3. Once you get a red/green signal arrow, check following two things:
First, blue circles lines are flat or not too slanted.
Second, red line is flat or little bit slanted.
4. If all the above conditions, met then put the order in on NADEX 5 minute binary options.
Red arrow => SELL signal
Green arrow => BUY signal
Money Management:
1. I enter a pending order at $35 ITM for sell orders and $65 for buy orders. (if you loose, you loose $65).
2. Once the order is filled, I do not wait for expiry. I exit out trend if I make 25 dollars. I put take profit orders at $10 for sell orders and $90 on buy orders.
That's it!
Email me at bhaveshjpatel2003@gmail.com to get an access to my system.

yutas_BOindicator2Ver .1.0
High-low sign indicator for binary option only.
バイナリーオプション専用ハイローサインインジケーター。
yutas_BOindicatorVer .1.0
High-low sign indicator for binary option only.
バイナリーオプション専用ハイローサインインジケーター。

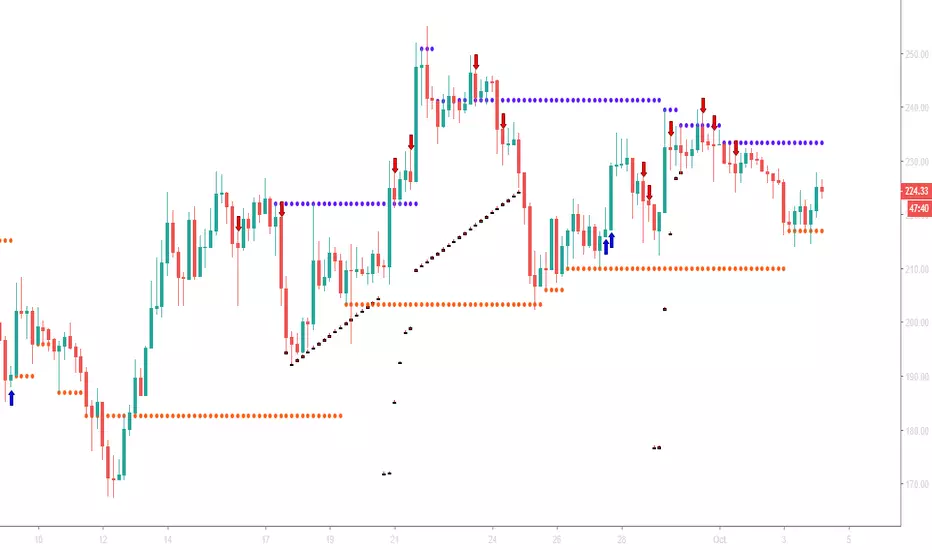
TradeMiner S9This is the first TradingView indicator EVER to include dynamic support and resistance lines from upper or lower diagonal highs and lows in real-time.
Note: This indicator has been built using Pinescript V2
Like and Share for access and more awesome indicators!
A blue arrow appears only in a red bar and under these conditions:
Closing Score Trigger (CS < 50)
On Balance Volume, Accumulation/Distribution, and Chaikin Money Flow Combination (OBV/AD /CMF > 0)
Chaikin Money Flow (CMF <-0.05)
A blue horizontal line will be drawn when CMF > 0.05 indicates a sale of the position.
A red arrow appears only in a green bar and under these conditions:
Closing Score Trigger (CS > 50)
On Balance Volume, Accumulation/Distribution, and Chaikin Money Flow Combination (OBV/AD/CMF < 0)
Chaikin Money Flow (CMF > 0.05)
A red horizontal line will be drawn when CMF <-0.05 indicates a sale of the position.
A new condition called " leaniency " has been added that allows all these conditions to be fulfilled within multiple bars so that the occurrence occurs more frequently. This will result in more signals appearing. Setting leniency to " 1 " means that all four conditions must occur in a single bar, while " 5 " means that all four conditions must occur within 5 bars.
Find lifetime access to the indicator here: www.kenzing.com
BTC

binary RSI(lir)
binary RSI oscillator is a powerful oscillator which shows the major trend according to momentum and volume

binary RSI(lir)binary RSI oscillator is a powerful oscillator which shows the major trend according to momentum and volume,

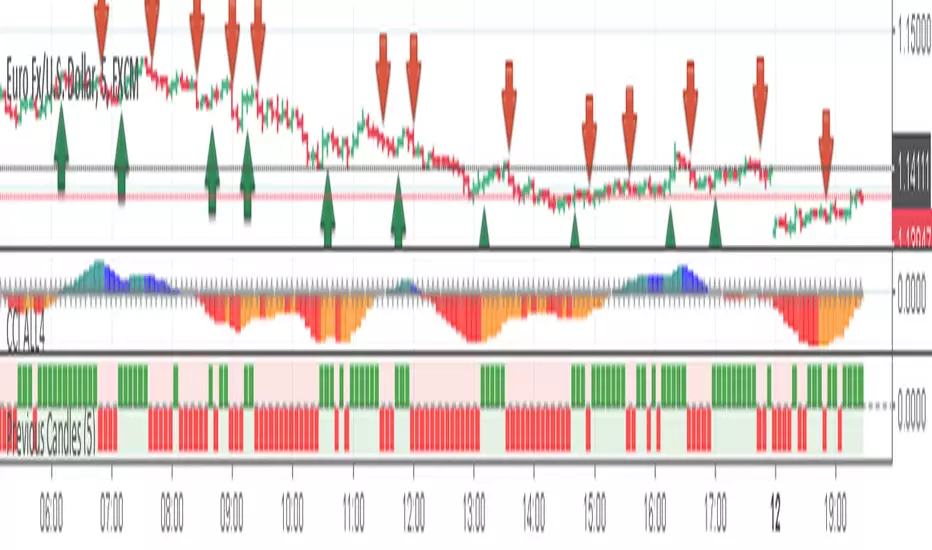
Previous CandlesThis is an indicator based on the average of the maximum and minimum of the past candle, and there is another strategy that makes the filter, it is very good for binary options, if you combine our indicator CCI and All4 it gets even better!
Currency: Any pair.
TimeFrame: 5m
Execute order: You can enter 1 minute or 5 minutes.
In the graph below the ICC, you can see the green and red squares, it works as follows.
Before giving any input you have to enter the change of a color.
Example: It was red and now it's green, so you could give the entry, but you must have at least 3 squares of red before, if only 1 squared has appeared, the hit percentage will be low!
The CCI indicator is for confirmation.
Any doubt I am available!
Note: This indicator does not make magic nor is it a holy grall, it is only an indicator to aid in binary operations!

OPTION COMBOA Combination of various Oscillators ie RSI, Stochastics, CCI and then Murrey filter to give more accurate signals to trade.
It is coded for Alerts, so you can do the manual Alerts setup.

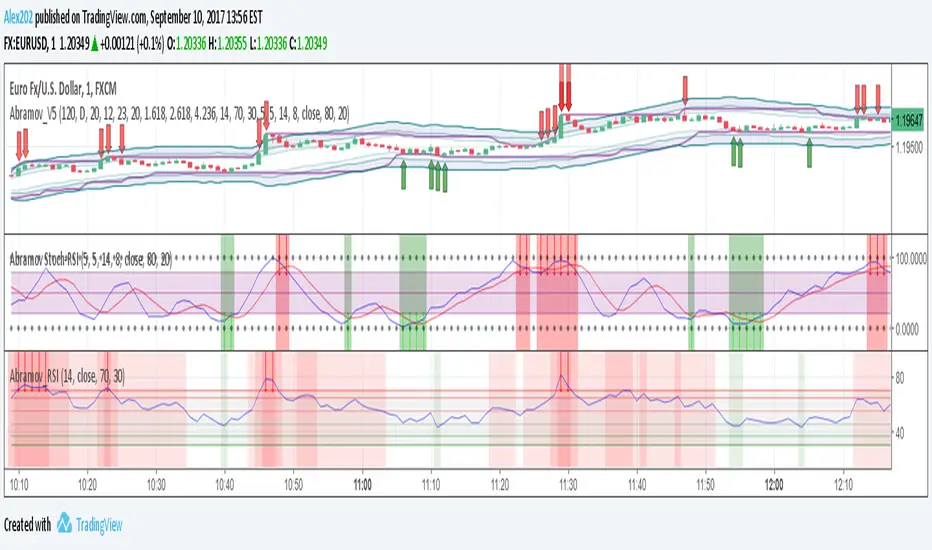
Abramov_V5Improved script Abramov_V4, has notifications
Recommended for binary options
Strategy is on my site
Multicurrency
Timeframe from 1 minute
Volatility - not lower than average
This indicator includes:
1. Bollinger waves 3 levels - incl. / off.
2. Moving averages 2 pieces - incl. / off.
3. Price channel - incl. / off.
4. Support and resistance level per day - incl. / off.
5. Support and resistance level for 120 minutes - incl. / off.
6. Arrows RSI + Stochastic buy / sell
7. Arrows to buy / sell on the price level in the channel
8. Customizable notifications from the indicator, now you do not need to waste time searching for a good entry point, notification comes in advance.
9. The indicator does not redraw!
Any of the indicators is configurable.
The optimal settings are set by default.
This indicator is suitable for several strategies.
Paid subscription to the indicator
When working with this indicator, it is necessary to avoid news and sudden jumps in the market
For additional signal filtering, I recommend:
Abramov_RSI - additional indicator
Abramov Stochastic-RSI - additional indicator
----------------------------------------------
Улучшенный скрипт Abramov_V4, имеет оповещения
Рекомендовано для бинарных опционов
Стратегия у меня на сайте
Мультивалютный
Таймфрейм от 1 минуты
Волатильность - не ниже среднего
Этот индикатор включает в себя:
1. Волны Боллинджера 3 уровня - вкл. / выкл.
2. Скользящие средние 2 штуки - вкл. / выкл.
3. Канал цены - вкл. / выкл.
4. Уровень поддержки и сопротивления за день - вкл. / выкл.
5. Уровень поддержки и сопротивления за 120 минут - вкл. / выкл.
6. Стрелки RSI+стохастик купить/продать
7. Стрелки купить/продать по уровню цены в канале
8. Настраиваемые уведомления от индикатора, теперь не нужно тратить время на поиски хорошей точки входа, уведомление приходит заранее.
9. Индикатор не перерисовывает!
Любой из индикаторов настраивается.
Оптимальные настройки устанавливаются по умолчанию.
Этот индикатор подходит для нескольких стратегий.
Платная подписка на индикатор
При работе с этим индикатором необходимо избегать новостей и резких скачков на рынке
Для дополнительной фильтрации сигналов рекомендую:
Abramov_RSI -дополнительный индикатор
Abramov Stochastic-RSI -дополнительный индикатор
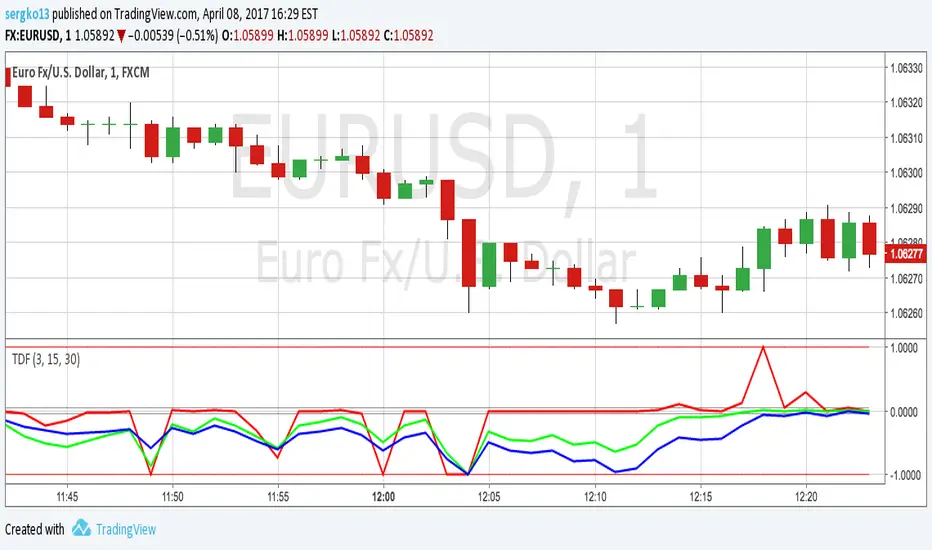
MoD_v1.3_StochRSIMultRSI_StrategyMulti timeframe trend trading strategy using TRIMA, StochRSI and RSI

MoD_v1_StochRSISMA_Strategy_Iteration1combines StochRSI, RSI, SMA and BB to find best reversal entries. Also has options for finding Divergence (TBC in Version 2 :-) )

Trend Direction and Force IndexTrend direction and force index for binary options. Minor corrections to code. All invite-only scripts have been disabled
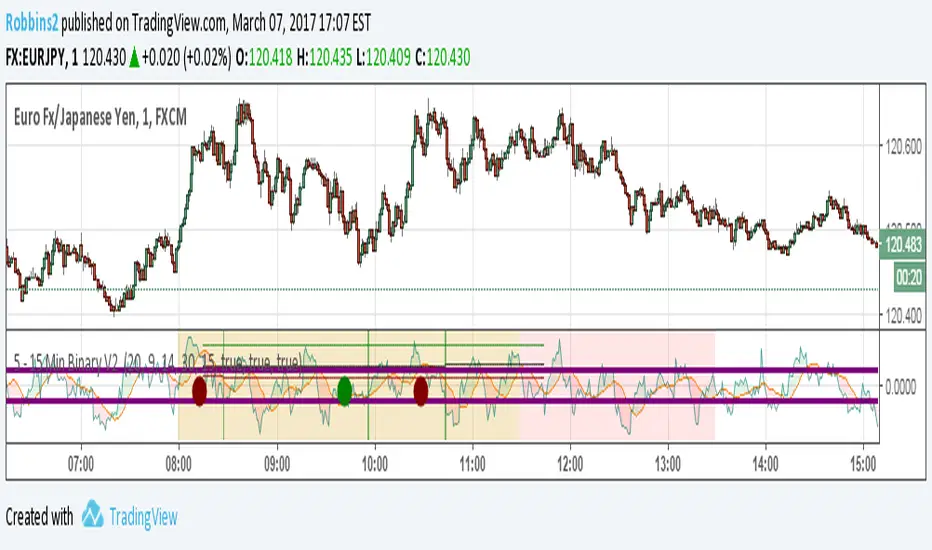
5 - 15 Min Binary V2 Hey guys
As promised back with the updated indicator without needing my blessing to use. Please post feedback so that I can perfect it.
Works great on EU/JP and USDCAD with a risk factor of 20 – 25. Use 1 time frame with 15 mins Expiry for nest results. Possible to get 90% ITM with this setup.
Updated Feature
Risk Factor: Higher the number lowers the risk but also means lower trade setups. Best between 20 – 25.
Added an additional Filter to minimize bad setups
No trading between 11.30 EST to 13.00 EST. Not worth the risk.
Displays ITM rate in Green, Red and total in Black.
Alert capable for Both, Call or Put
Please demo before you take it live. Also during normal trading hours I have not seen more than 3 consecutive loses, (unless there is a news release) so with money management you can greatly increase your total ITM rate.
If you like this indicator, feel free to donate some BTC at 18qrzku9LrQuMq9LyRYmiTbqUtC2bSAv3y
It does take considerable amount of tweaking and testing to put out something like this.
Post feedback so that everyone can benefit.
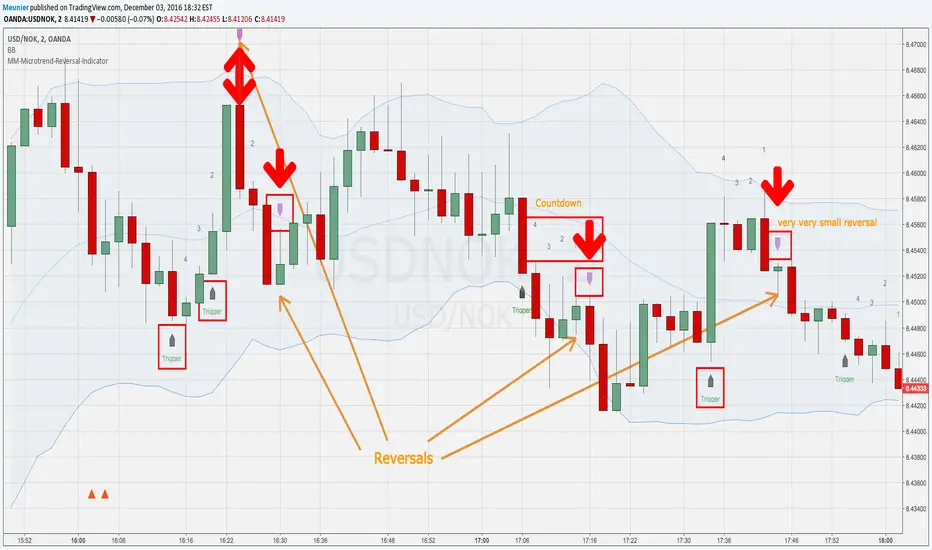
MM-Microtrend-Reversal-IndicatorThis indicator detects microtrend reversals based on crossing of the DMI+ and DMI- + signals
It indicates the trigger event on the chart as well as the reversal candle
In addition to that it shows a countdown above the bars
This is helping when multiple reversals occur
Important: when the Bollinger Bands are crossed in the previous bars it's possible that the prognosted reversal will NOT show up
Recommended timeframes are M1 and M2
Avoid trading sideway trends, the reverals are low and reversal triggers and assumed reversal candles could get chaotic

MM-Microtrend-Reversal-IndicatorThis indicator detects microtrend reversals based on crossings of the DMI+ and DMI- signals
It indicates the trigger event on the chart as well as the reversal candle
In addition to that it shows a countdown above the bars
This is helping when multiple reversals occur.
Important: when the Bollinger Bands are crossed in the previous bars it's possible that the prognosted reversal will NOT show up
Recommended timeframes are M1 and M2
Avoid trading sideway trends, the reversals are low and reversal triggers and assumed reversal candles could get chaotic sometimes