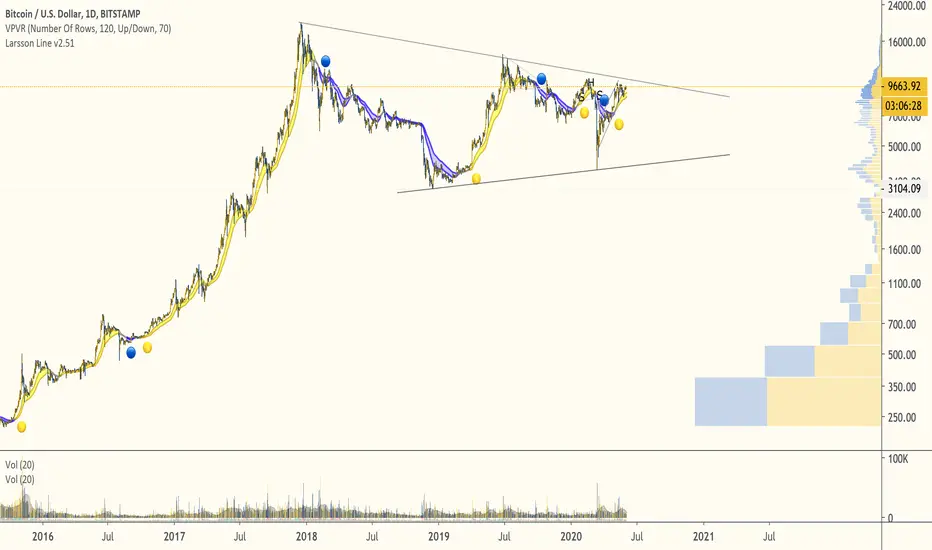
Larsson LineThe Larsson line supports trend trading of tech assets over long timeframes:
- Trend trading (unsuitable for range trading)
- 4h candles to monthly candles (less suitable for hourly candles, unsuitable for high-frequency trading)
- Tech stocks and cryptocurrencies (not designed for commodities)
The indicator can aid traders following a rule based trading system by providing measure of trend consistency that is always in exactly 1 of 3 states - up, down or inconclusive, while masking inner states.
This edition handles more edge cases than the previous indicator and is intended to replace it after a period of live use.
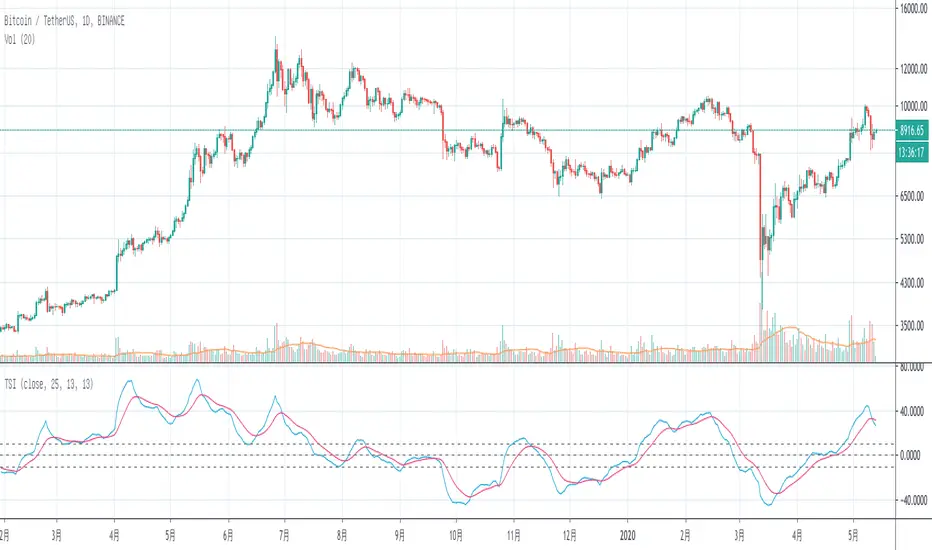
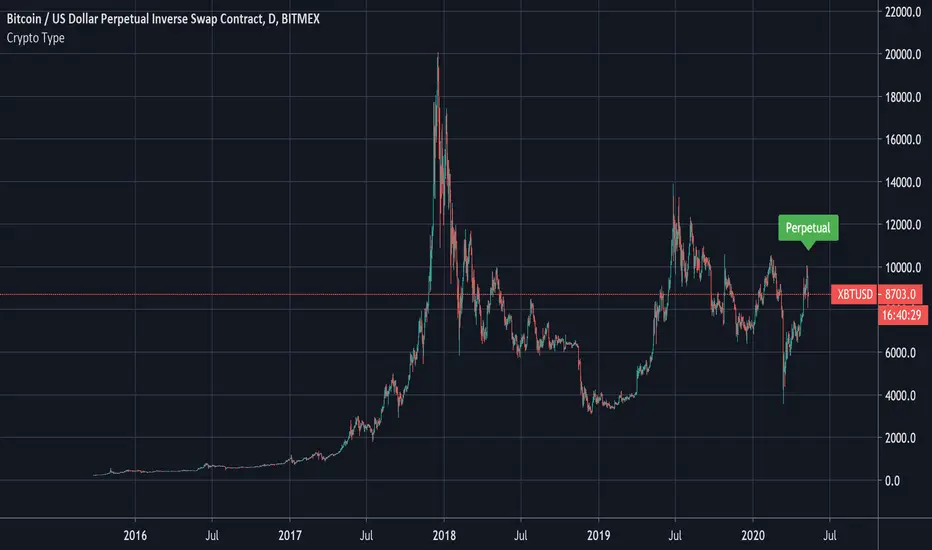
Bitcoin (Cryptocurrency)
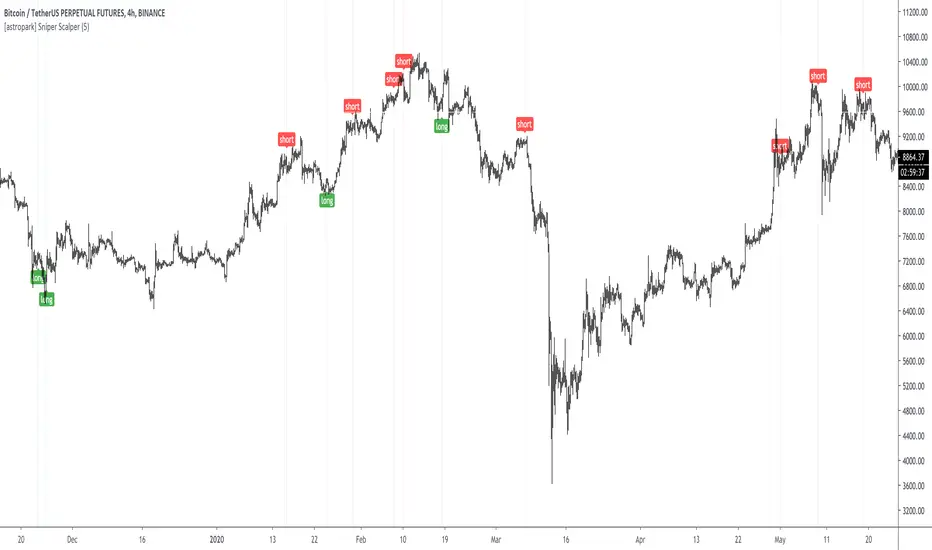
[astropark] Sniper ScalperDear Followers,
today a new Scalper Tool , which works great on all timeframes , from 1 minute to 1 month!
Keep in mind that this is a Scalper, so it's always a good idea to take or lock your profits, despite you may use it also for swing trading.
This tool has some cool features:
it works on all timeframes , from 1 minute to 1 month!
you can change a filter option from 1 (lowest) to 7 (highest)
Here some examples on how it performs on many timeframes and charts.
EURUSD 15m chart
AMZN 1h chart
Bitmex XBTUSD 4h chart
Bitfinex ETHUSD 1h chart
Binance Chainlink LINKBTC 1h chart
Binance Ethereum ETHBTC 1h chart
GOLD XAUUSD 15m chart
The user who wants to use this strategy, especially via an automated bot, must always manage to set a take profit and stoploss, as well as use a proper money and risk management strategies .
This is not the "Holy Grail", so use it with caution.
This is a premium indicator , so send me a private message in order to get access to this script.
Bitcoin Dominance MomentumThis is a simple study of Bitcoin Dominance vs Altcoin Performance.
The general idea, is that as Bitcoin Dominance falls, Altcoins rise, and vice versa.
So, I decided to plot a MACD indicator of CRYPTOCAP:BTC.D to judge macro turning points in the cryptocurrency markets.

BTC D&T Index by BensonThis indicator shows the long-term bottom and top of BTC's price.
Factors including hashrate, future market sentiment and CME's open data.
Use this indicator to identify the best timing to buy or sell BTC.
Note: the indicator should only be applied in D timeframe.
這個指標用來標示比特幣價格長週期的底部與頂部。
指標參考了比特幣算力、遠期合約基差、永續合約資金費率以及芝加哥期貨交易所的大戶持倉數據。
善用這個指標去找出低價掃貨或是高價賣出比特幣最好的時機。
備註:指標只適用在「日」時框

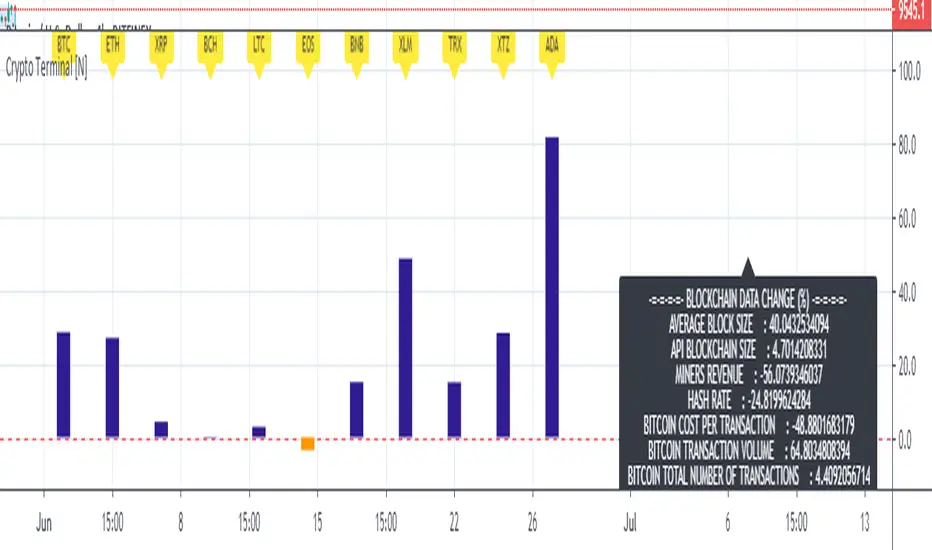
Basic Cryptocurrency TerminalHello,
This script is a simple Cryptocurrency Terminal.
It serves the same purpose as Heatmaps.
You can also set the period to look back manually in the menu.
Major Cryptocurrencies are taken into account.
And various Blockchain data are shown in the information panel.
In this way, an idea can be obtained about Cryptocurrency Market.
It is visually more convenient and clear to use in an indicator window under the chart, not on the chart, as follows:
Regards.
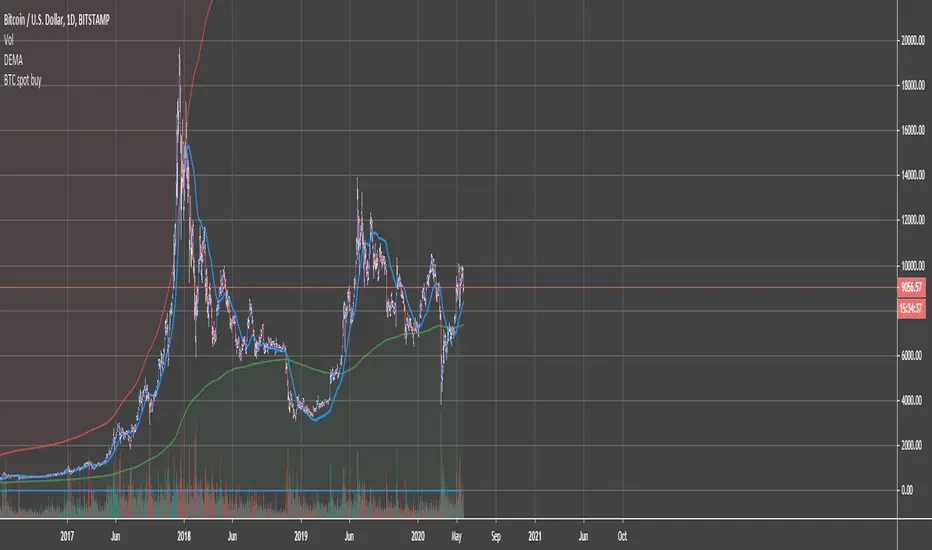
BTC Fibonacci DMA350 TrendlinesAdapted from Tim Graham's Code.
See Original Inspiring Article from Phillip Swift at: @positivecrypto
When looking into BITSTAMP:BTCUSD 1D data in spreadsheet. Historically, BTC Highs Hit (Simple Daily Moving Average 350 Days) DMA350 in reverse Fibonacci Sequence Order
2013 Hit DMA350*8 before All Time High (ATH)
2017 Hit DMA350*5 before ATH
I expect 2021 to hit DMA350*3 ATH. When BTC hits DMA350*3 ATH, I suggest selling!

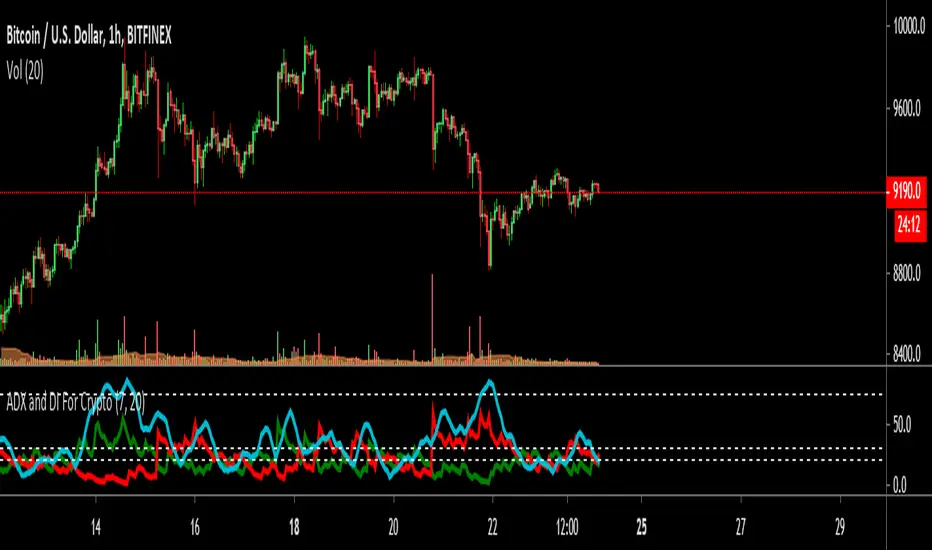
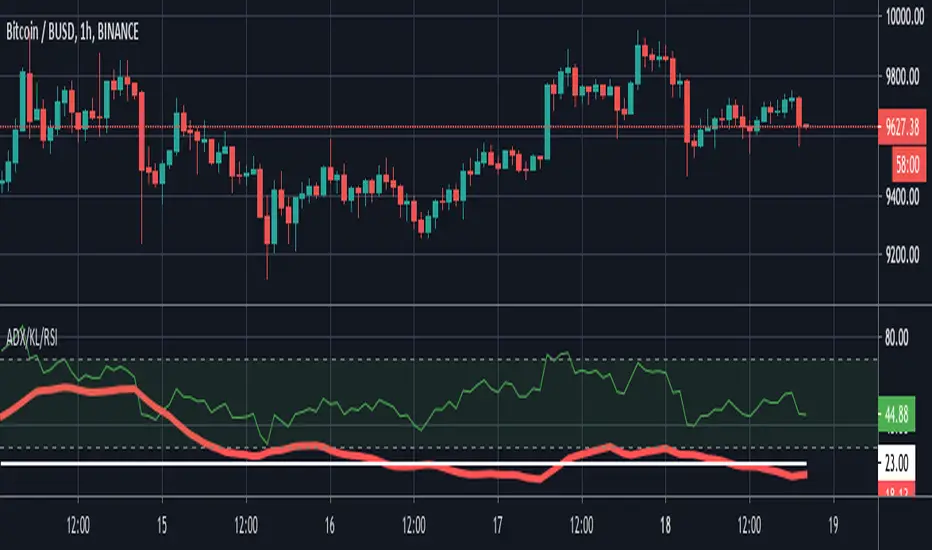
ADX and DI For Cryptocustomized version to add my favourite settings for crypto
Best time frame is daily followed by 4H
ADX Near 20 or less means trend is choppy and weak
ADX Cross over 30 means trend is starting to gain momentum
ADX Near 75 means momentum is near maximum, trend needs to rest for a while ( The area between 70~90 )
MAPS - ALTs Trend Scanner v3The Altcoin trend scanner allows you to enter in your preferred exchange/ticker and it'll check whether there's a trend currently in place. The strongest correlation to price movement is when you're able to catch the beginning of the color change. Use it together with the breakout indicator for best results.
Use the link below to obtain access to this indicator

BTC Accumulation/Distribution ZonesAccumulate, when the price is in the green zone and distribute in the red zone. Use it on Bitcoin/Usd Bitstamp or Bitfinex preferably.
Right-click on the Y-axis and select "Scale to Price only" so the indicator doesn't mess up your scale. Enjoy!
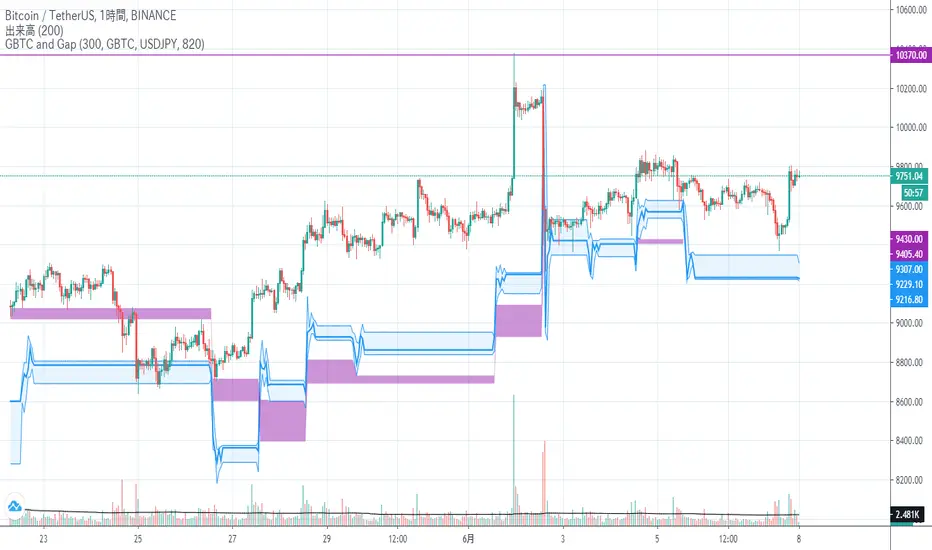
GBTC and GapThe GBTC rate can be converted appropriately and displayed, and the previous window can be displayed.
When the BTCUSD is bullish, the GBTC rate is likely to be a leading indicator, and the amount of inflow of funds from outside may be used to judge the trend.
You may also be able to analyze hidden support at the window position.
GBTCレートを適当に変換して表示し、さらに直前の窓を表示できます。
BTCUSDは強気相場の時、GBTCレートが先行指標になる可能性が高く外部からの資金流入の量をトレンドの判断に使うことができる可能性があります。
また、窓の位置で隠されたサポレジを分析できるかもしれません。
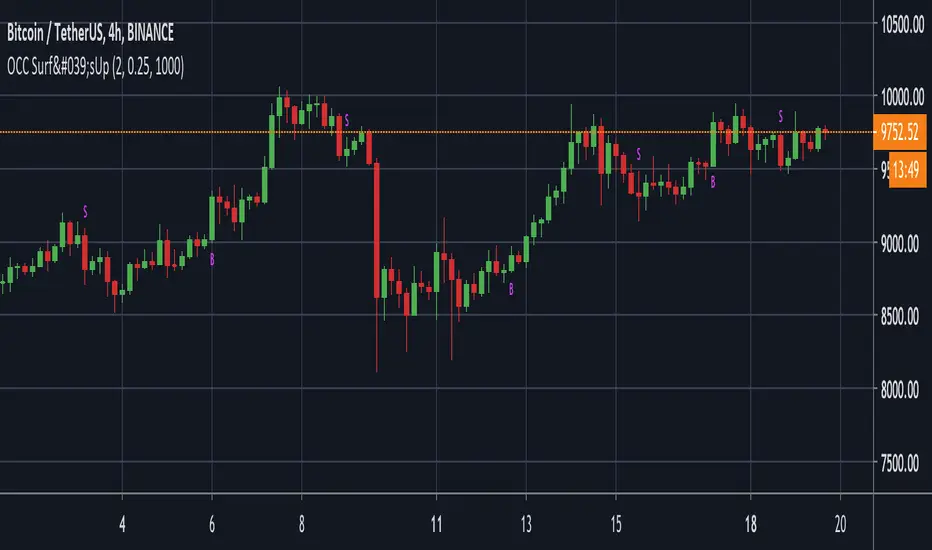
Surf's Up Alerts 1.0Optimal Markets - USDT/ BTC -USD/ BTC all major exchanges
Optimal Chart - 4H
Average trades - 1-2/week
YTD Profit (0 leverage) = 62%
This script was designed to give new traders confidence and some guidance when entering into the crypto trading industry.
When added to the USD/ BTC 4H (optimal) charts of any high volume exchange, three new alert conditions will appear under the Surf's Up indicator alerts. Turn on the "Buy Signal" and "Sell Signal" to be alerted of potential large price increases. This script analyzes multiple data pieces to determine points in which the price has the highest probability of moving up, along with a sell alert that will alert the user of either: the point at which the trend is dying and to take profit OR that the trend is not happening, and to cut your losses. "Secure Profit" can be set to alert you of given profit target, at which time you can set a stop loss just above break even, essentially making a risk-free trade! This is OPTIONAL as it could cause you to a leave a large winning trade too early as well :)
Buy and Sell conditions have been programmed to know when the user is already in a trade, so multiple alerts will not fire, allowing full integration of auto trading as well.
Surf's Up is a back-tested strategy turned study in order to give high potential trade alerts. This way, anyone can easily add the script to the BTC/USD 4H chart, and simply turn on/off any of the 3 alerts: Buy, Sell, or Secure Profit.
You can get more information along with access to this script/alert system by clicking the link in the signature, or sending us a PM here on Tradingview.
Happy Trading!
ADX + Keylevel + RSIThis script is a combination of the Average Directional Movement Index (ADX) help to determine the trend strength with a key level and Relative Strength Index is an oscillator that measures the speed and change of price movements.
MyAlgoPLEASE READ THE ENTIRE POST BEFORE PURCHASING & USING THE MyAlgo Tool. Saves you and me some time in emails and messages. :)
This is the official version of MyAlgo
PLEASE UNDERSTAND THAT THIS IS A DIFFERENT AND SEPARATE PRODUCT AND SCRIPT FROM "MyAlgo SLIM" FROM THE MyAlgo TRADING TOOL SERIES
Description
Buy & Sell Alerts can be set on all Tickers. This includes, but is not limited to Crypto, Commodities , FOREX, Equities and Indices. Also all candle Types are compatible.
Recommended Time-frames - Due to the complexity of MyAlgo-SLIM the user has a choice between three algorithms and is like that able to trade on all timeframes with the highest returns.
MyAlgo combines many different aspects at the same time, scans multiple other Algorithms and comes to a conclusion based on over 1350 lines of code.
It is based on Divergences, Elliott Waves , Ichimoku , MACD , MACD Histogram, RSI , Stoch , CCI , Momentum, OBV, DIOSC, VWMACD, CMF and multiple EMAs.
Every single aspect is weighted into the decision before giving out an indication.
Most buy/sell Algorithms FAIL because they try to apply the same strategy to every single chart, which
are as individual as humans. To conquer this problem, MyAlgo has a wide range of settings and variables which can be easily
modified.
To make it a true strategy, MyAlgo has as well settings for Take Profit Points and Stop
Losses. Everything with an Alert Feature of course so that FULL AUTOMATION IS POSSIBLE.
I know from experience that many people take one Algorithm and are simply too LAZY to add multiple Algorithms to make a rational choice. The result of that is that they lose money, by following blatantly only one Algorithm.
MyAlgo has additional 15 Indicators, perfect for all markets, which can be turned on and off individually.
Side Notes
MyAlgo is being updated and upgraded very frequently to suit the requests of our customers.
This is not financial advice. Please read our disclaimer before using.
Anything below this sentence will be Updates regarding MyAlgo
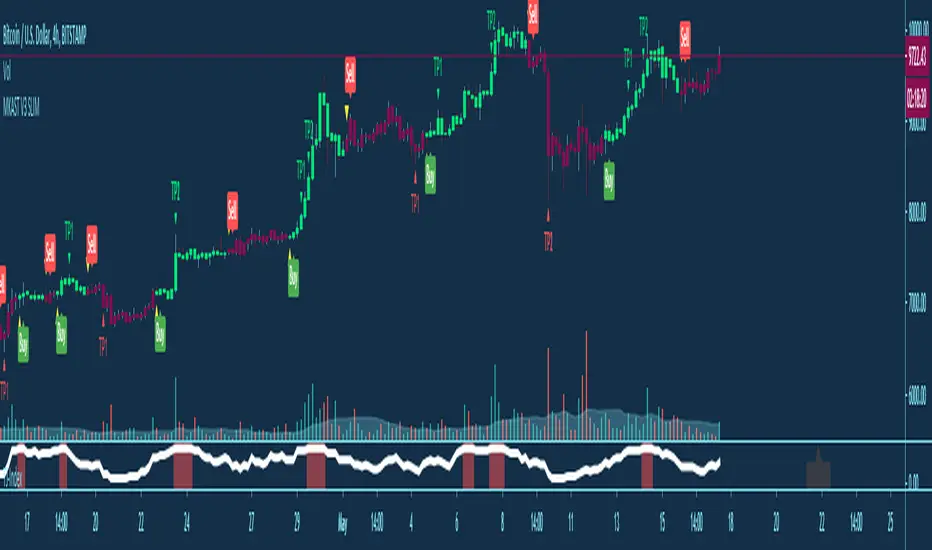
MyAlgo-SLIMPLEASE READ THE ENTIRE POST BEFORE PURCHASING & USING THE MyAlgo-SLIM Tool. Saves you and me some time in emails and messages. :)
This is the official version of MyAlgo-SLIM
Description
Buy & Sell Alerts can be set on all Tickers. This includes, but is not limited to Crypto, Commodities , FOREX, Equities and Indices. Also all candle Types are compatible.
Recommended Time-frames - Due to the complexity of MyAlgo-SLIM the user has a choice between three algorithms and is like that able to trade on all timeframes with the highest returns.
MyAlgocombines many different aspects at the same time, scans multiple other Algorithms and comes to a conclusion based on over 1350 lines of code.
It is based on Divergences, Elliott Waves , Ichimoku , MACD , MACD Histogram, RSI , Stoch , CCI , Momentum, OBV, DIOSC, VWMACD, CMF and multiple EMAs.
Every single aspect is weighted into the decision before giving out an indication.
Most buy/sell Algorithms FAIL because they try to apply the same strategy to every single chart, which
are as individual as humans. To conquer this problem, MyAlgo has a wide range of settings and variables which can be easily
modified.
To make it a true strategy, MyAlgo has as well settings for Take Profit Points and Stop
Losses. Everything with an Alert Feature of course so that FULL AUTOMATION IS POSSIBLE.
I know from experience that many people take one Algorithm and are simply too LAZY to add multiple Algorithms to make a rational choice. The result of that is that they lose money, by following blatantly only one Algorithm.
MyAlgo has additional 15 Indicators, perfect for all markets, which can be turned on and off individually.
Side Notes
MyAlgo is being updated and upgraded very frequently to suit the requests of our customers.
This is not financial advice. Please read our disclaimer before using.
Anything below this sentence will be Updates regarding MyAlgo-SLIM
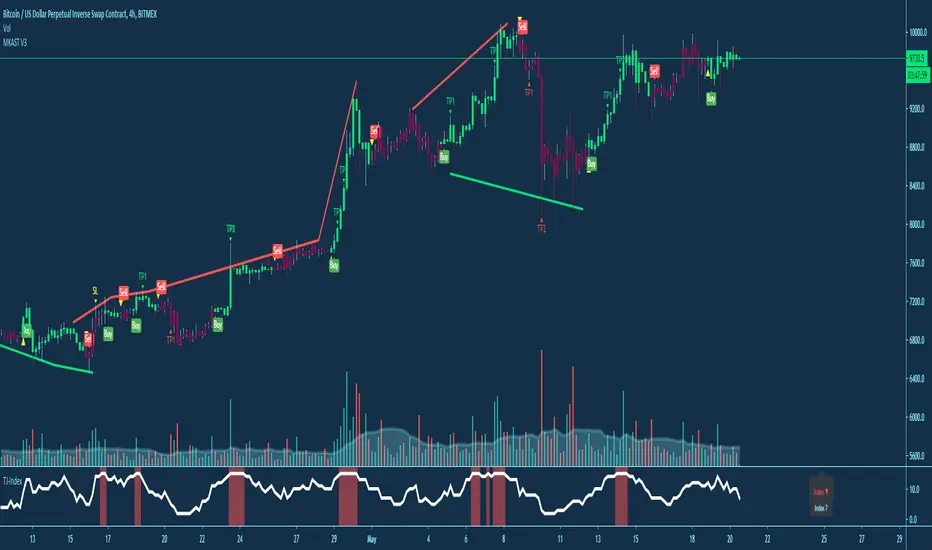
Musashi-Hidden-Wave Trading SystemThis Indicator is a full trading system that offers setups with Entries and Targets and Trade Management. This indicator is very accurate because it uses advanced setup detection and filtering logic.
The setup is triggered if the price passes the blue dash. Do not enter the trade unless price passes the blue dash. Each setup has 3 possible targets, which are dashes colored green for longs and red for shorts.
You can use the baseline (which is a trend-line that is either green for bullish or red for bearish ) to manage the trade. You should only enter long trades if the trend-line is green, and only enter short trades if the trend-line is red. One strategy would be if you enter a trade long, and reach the first target, you can take some profits, but still let the some of the position run, where a bar closing beyond the baseline or breaks a prior opposite pivot, would stop out your remaining position.
To summarize:
Blue Dash = Entry Trigger
Green Dashes = Long Targets (3 of them, for different price targets: target 1, 2 and 3)
Red Dashes = Short Targets (3 of them, for different price targets: target 1, 2 and 3)
The great thing about this indicator is that its universal, there are no settings necessary -- just put it on the chart and it finds high probability setups and paints it on the chart as they occur. There is NO Repainting with this indicator.
Of course, you can add other indicators if you wish, and even add this indicator to your existing trading system.
Again, this indicator does NOT repaint.
Once a setup is found, the indicator draws the entry trigger price and the targets at the setup bar close.
Setup Alerts are fully supported, via email, sms , and desktop notification.
*If you wish to license this indicator, please contact me via private message for details regarding access. Thank you.
LEGAL STUFF:
Risk Disclosure
Futures , forex, stock, crypto and derivative trading contains substantial risk and is not for every investor. An investor could potentially lose all or more than the initial investment. Risk capital is money that can be lost without jeopardizing ones’ financial security or life style. Only risk capital should be used for trading and only those with sufficient risk capital should consider trading. Past performance is not necessarily indicative of future results
Hypothetical Performance Disclosure
Hypothetical performance results have many inherent limitations, some of which are described below. no representation is being made that any account will or is likely to achieve profits or losses similar to those shown; in fact, there are frequently sharp differences between hypothetical performance results and the actual results subsequently achieved by any particular trading program. One of the limitations of hypothetical performance results is that they are generally prepared with the benefit of hindsight. In addition, hypothetical trading does not involve financial risk, and no hypothetical trading record can completely account for the impact of financial risk of actual trading. for example, the ability to withstand losses or to adhere to a particular trading program in spite of trading losses are material points which can also adversely affect actual trading results. There are numerous other factors related to the markets in general or to the implementation of any specific trading program which cannot be fully accounted for in the preparation of hypothetical performance results and all which can adversely affect trading results


Bitmex Premiums RSIPlot the BITMEX:XBT - COINBASE:BTCUSD premiums spread as a RSI.
Can be used to see if futures are skewed towards backwardation/contango extremes.

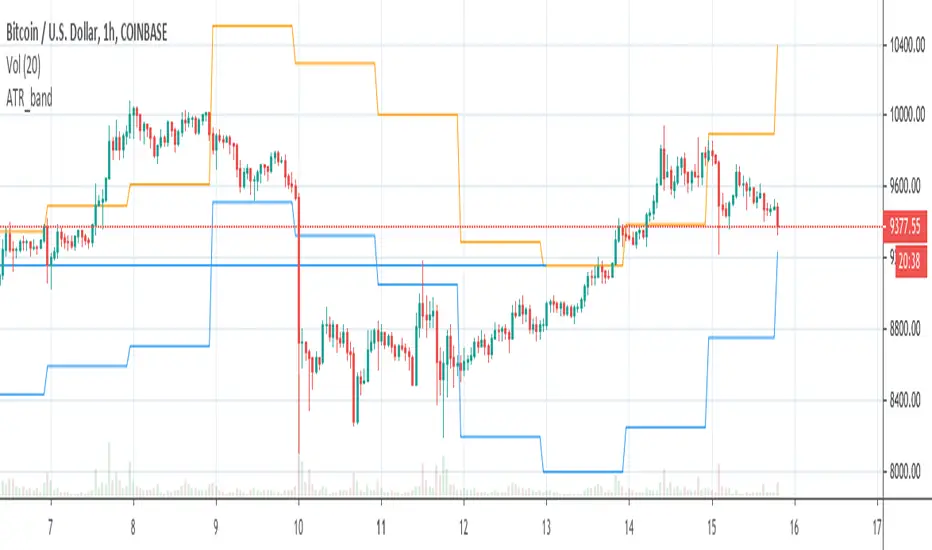
ATR_bandCreates lower and upper band on BTCUSD chart based on ATR value of the previous day and daily open of the current day
Golden Ratio MultiplesI call this "Phi Ribbons." The Golden Ratio, also known as Phi, is fantastic at predicting areas of price reversal.
Every moving average is a fibonacci multiple of the base function 355 SMA .
The rainbow above is an array of fibonacci multiples that are greater than one (1.618, 2, 2.618, 3, 5, 8, 13, 21)
The rainbow below is an array of fibonacci multiples that are less than one (0.786, 0.618, 0.5, 0.382, 0.236, 0.14)
Notice the precision of marking areas of potential price reversals
EASTER EGG: The two moving averages at the top of the script are 355 SMA & 113 SMA . This is one of the lowest ratios that closely approximates Pi (3.14159).
Simply plotting the 133 SMA will add a unique feature:
355/133 = 3.14159
When the 113 crosses below the 355 it tends to mark the end of major bullish impulses, and a crossover is a bullish sign.

Close IndicatorThis indicator plots out several horizontal lines, they can be used as both support and resistance. The transparent lines a little above and below the lines are "spread lines" which are intended to be used to place orders such that in case price gets very close but not exactly the same price, the long/short orders still get filled.
The lines themselves are plotted using some candle closes +- some spread (which can be adjusted to fit the asset you are trading)
The longer the line is, the more importance it has, the length of the lines are in this order (by colour)- White > Pink > Peach > Gray > Purple > Orange > Teal > Yellow
Orange, Teal and Yellow lines are only to be used for scalping, all the other lines can be used for everything else (swing trading, scalping, accumulation, long term trading)

Crypto Type: Regular, Perpetual, Or Futures?A simple way to find out if the security in question is a regular, perpetual, or futures pair.
This reads the data of the security's description and sees if the word perpetual or futures is mentioned.
The method to check if a string has the letters we seek was first introduced by MichelT .
Thank you for checking this out and I hope this helps unlocking new hidden potential.
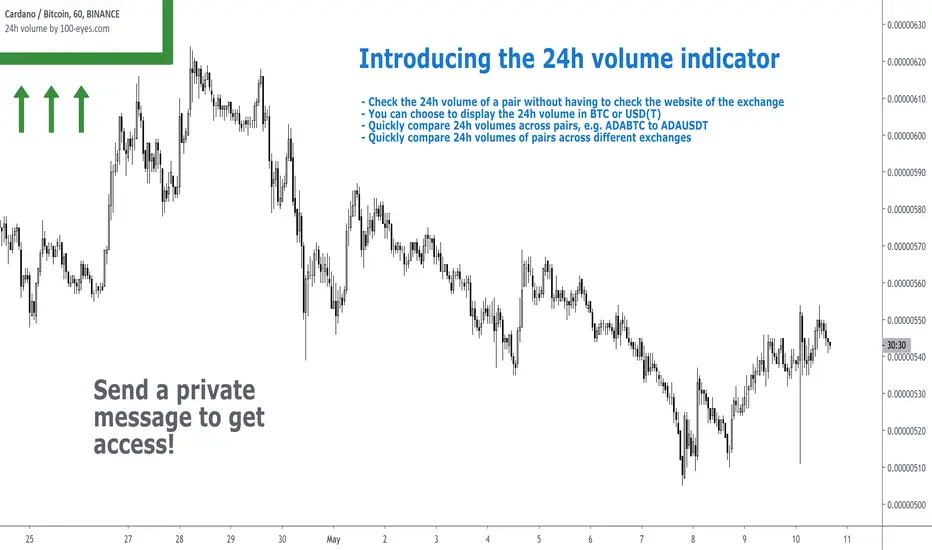
24h volume by 100eyesIntroducing the 24h volume indicator on Tradingview!
DM me (Trading-Guru) here on Tradingview to get access to this indicator.
100eyes asked me to create a new Tradingview indicator that estimates the 24h volume of a pair. Works for all BTC/USDT/USD/ETH crypto pairs. You can choose to display the 24h volume in BTC or USD(T).
This indicator allows you to:
Check the 24h volume of a pair without having to check the website of the exchange
Quickly compare 24h volumes across pairs, e.g. ADABTC to ADAUSDT
Quickly compare 24h volumes of pairs across different exchanges
Volume is an important factor in crypto trading to estimate liquidity. Use this indicator to adjust your position size according to the volume of a pair.
Even on the website of an exchange, it's difficult to compare volume since for example volumes of USDT pairs are expressed in USDT, and volumes of BTC pairs are expressed in BTC. This indicator solves that problem by expressing everything in the same currency, and also directly on Tradingview!
F.A.Q.
Q: How do I get access to the indicator?
A: DM Trading-Guru on Tradingview.
Q: Why are there different values for different timeframes?
A: That is due to Tradingview limitations. The smaller the timeframe, the more accurate the displayed value. The timeframe you're looking at equals the maximum amount of lag.
Q: I'm on the Tradingview mobile app, why is the value is not displayed next to the indicator's name?
A: Click somewhere inside the chart. Then the indicator value will appear.