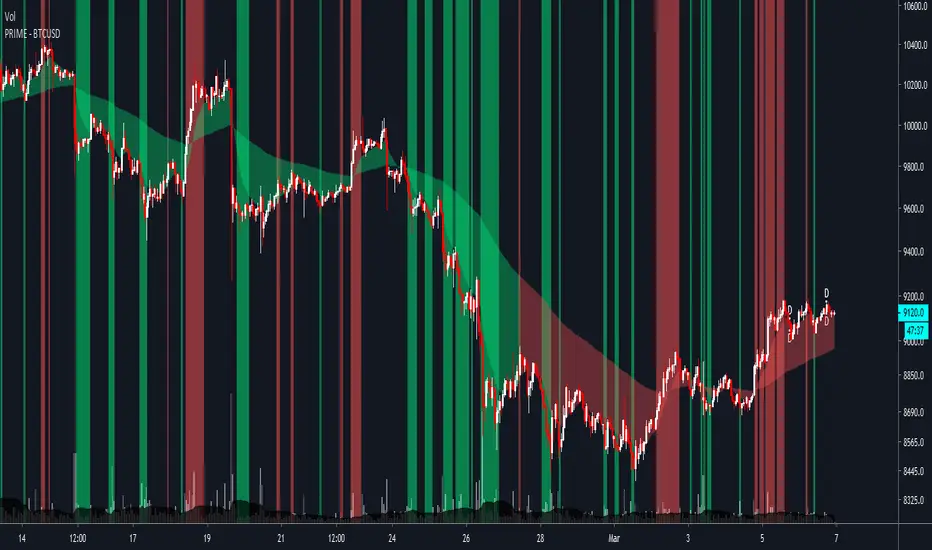
PRIME - BTCUSD - BYBITPRIME is a hyper-focused indicator made for a specific asset and timeframes. The goal of the indicator is to help you simplify and optimize your trading.
As of writing this, the indicator is optimized for the 1H and 4H timeframes.
The indicator will provide you with:
Potential buy and sell zones (the green and red vertical lines/flashes).
The trend of the market, with the cloud as support/resistance.
And the daily, weekly and monthly closes (as D, W and M).
In addition to these, the indicator also comes with the following alerts:
BUY ZONE
SELL ZONE
STOPPED FLASHING
CLOUD TOP X
CLOUD BOTTOM X
These alerts will allow you to know when some of the best opportunities in the market might be present.
This specific version of the indicator is for BTCUSD . However, I can adjust it to your favorite asset.
For access, questions, and full documentation, please message me here on TradingView.
Bitcoin (Cryptocurrency)
BTC Bullish or Bearish (Joy)Quite often we are faced with the question of whether Bitcoin is macro bullish or bearish.
I tried to take a punch at this.
There many ways to find that answer.
This is one crude way.
Whenever the background colour is light lime, it means it thinks the Bitcoin is macro bullish
Whenever the background colour is red lime, it means it thinks the Bitcoin is macro bearish
How would I use this information?
I can possibly use it in position sizing and hedging. If I see a sell in a lime background, I can potentially just hedge & vice versa.
Do note that it works best in the higher timeframes.
Do note that it is not supposed to be used to open any new trade or to close any trade.
I use it alongside other indicators for confirmation bias.
This can possibly be used for other instruments. As I only use it for trading BTCUSD, I have crudely tested for BTCUSD
For info on gaining access see the ⬇ link below ⬇ in our signature field & direct message me. I have a busy schedule at my own workplace. Trading is my hobby. Hence, please be kind to me if I am late in replying.
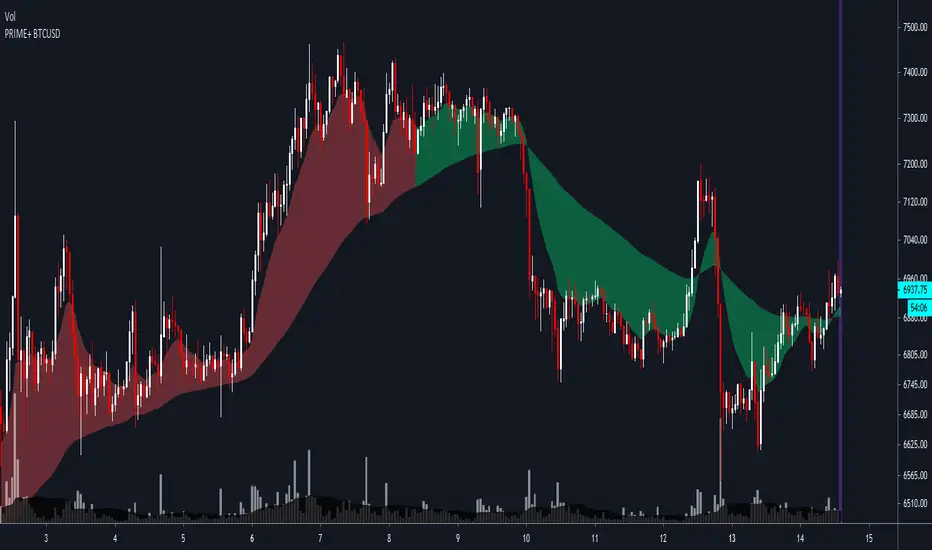
PRIME+ BTCUSDPRIME+ is a hyper-focused indicator made for a specific asset and timeframes. The goal of the indicator is to help you simplify and optimize your trading.
As of writing this, the indicator is optimized for the 3m and 1H timeframes.
The indicator will provide you with:
Potential buy and sell zones (the green and red vertical lines/flashes).
The trend of the market, with the cloud as support/resistance.
The daily, weekly and monthly closes (as D, W and M).
And additional tools for the 3m for best entries and exits.
In addition to these, the indicator also comes with alerts for the flashes:
BUY ZONE
SELL ZONE
These alerts will allow you to know when some of the best opportunities in the market might be present.
This specific version of the indicator is for BTCUSD . However, I can adjust it to your favorite asset.
For access and questions, please message me here on TradingView.
GapGap
I've seen many trade decisions based on the CME Bitcoin Futures gap, so this indicator will let you know if that strategy is good or not, so use it as another confirmation 👍🏻.
- Shows when a gap is created, when it is filled and if not filled if a new gap is created.
- You can also use another security as a reference.
- Multi Timeframe , by default it will search the daily gaps.

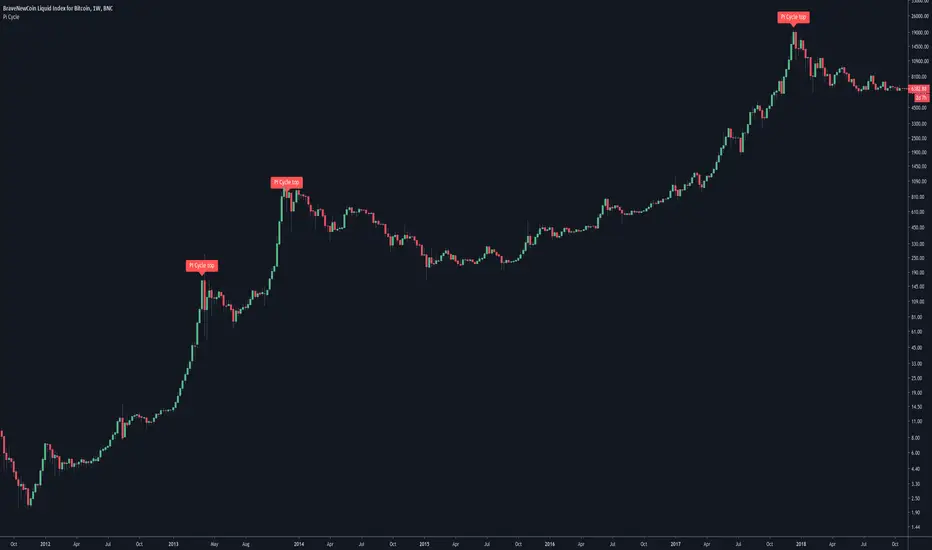
Pi Cycle Bitcoin top indicatorThe Pi Cycle Top Indicator has historically been effective in picking out the timing of market cycle highs to within 3 days.
It uses the 111 day moving average (111DMA) and a newly created multiple of the 350 day moving average, the 350DMA x 2.
Note: The multiple is of the price values of the 350DMA not the number of days.
For the past three market cycles, when the 111DMA moves up and crosses the 350DMA x 2 we see that it coincides with the price of Bitcoin peaking.
It is also interesting to note that 350 / 111 is 3.153, which is very close to Pi = 3.142. In fact, it is the closest we can get to Pi when dividing 350 by another whole number.
It once again demonstrates the cyclical nature of Bitcoin price action over long time frames. Though in this instance it does so with a high degree of accuracy over the past 7 years.
Full Credit to PositiveCrypto
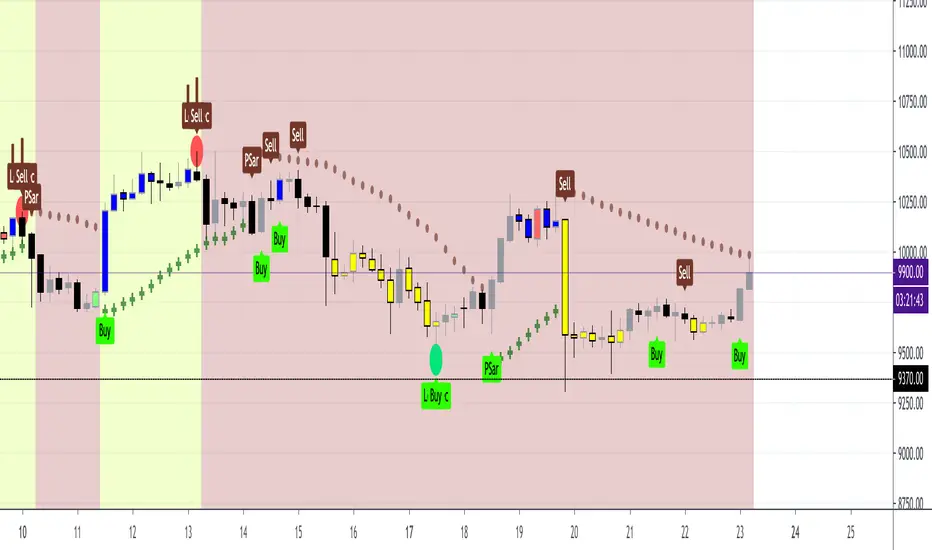
Pivot Boss 4 EMA + BB + Parabolic SAR + IchimokuA combination of a few of my favorite indicators.
1) Pivot Boss 4 EMA
2) Bollinger Bands
3) Parabolic SAR
4) Ichimoku Cloud
All credit to original authors.

PRIME - XBTUSDPRIME - XBTUSD is an indicator made specifically for XBTUSD on the 1 hour timeframe .
The indicator will help you know:
Potential areas to buy and sell (the flashes).
The trend of the market (the wavy cloud).
Important support/resistance areas (the wavy cloud).
And the daily, weekly and monthly closes (as D, W and M).
The indicator comes with the following alerts:
BUY BTC (1H)
SELL BTC (1H)
The alerts must be set on the 1 hour timeframe.
The goal of the indicator is to make trading simple and sustainable regardless of your lifestyle.
PS. The buy and sell flashes only show on the 1 hour; and the cloud and closes up to the 12 hour (to keep the chart clean).
PPS. For access and questions, message me here on TradingView. If you need it for another asset, I can adjust the settings for you.

PRIME - BTCUSDPRIME - BTCUSD is an indicator made specifically for BTCUSD on the 1 hour timeframe .
The indicator will help you know:
Potential areas to buy and sell (the flashes).
The trend of the market (the wavy cloud).
Important support/resistance areas (the wavy cloud).
And the daily, weekly and monthly closes (as D, W and M).
The indicator comes with the following alerts:
BUY BTC (1H)
SELL BTC (1H)
The alerts must be set on the 1 hour timeframe.
The goal of the indicator is to make trading simple and sustainable regardless of your lifestyle.
PS. The buy and sell flashes only show on the 1 hour; and the cloud and closes up to the 12 hour (to keep the chart clean).
PPS. For access and questions, message me here on TradingView. If you need it for another asset, I can adjust the settings for you.


Bitcoin Logarithmic Growth Curves & ZonesI found this awesome script from @quantadelic and edited it to be a bit more legible for regular use, including coloured zones and removing the intercept / slope values as variables, to leave space for the fib levels in the indicator display. I hope you all like it.

Price Streak Is Another Way to Spot TrendsPrice is never wrong, but sometimes reading it can be tricky.
Movements in the broader market or a sector can distract from a symbol that's been steadily trending in one direction or another. Sometimes the beginning of a move can also be so subtle that it flies under most people's radar.
Price Streak can help overcome these limitations by tracking consecutive up/down periods. It plots an easy-to-read color-coded histogram.
Because it simply counts the candles in a trend, Price Streak can give a clearer picture than magnitude-biased indicators like relative strength or MACD.
Applying Price Streak to the daily chart of Bitcoin Dominance , we find something very interesting right now: the longest drop since March 2017.
That moment in history, almost three years ago, marked the beginning of the last Altcoin bull market. Ethereum , for example, went from roughly $60 to over $1,300 in the following nine months.
While past performance isn't a guarantee of future results, this illustrates how sustained price moves can reveal changes in character.
Based on Price Streak's current reading, it may support the idea of another Altcoin cycle beginning now.

MACD & Mayer multpile Crypto-EmbassyThis is a combination of two indicators MACD & The Mayer Multiple.
MACD = Short for moving average convergence/divergence. It is designed to reveal changes in the strength, direction, momentum, and duration of a trend in a stock's price.
You will find the normal histogram and also a generated trend line (green = bullish , red = bearish )
The Mayer Multiple = The Mayer Multiple was created by Trace Mayer as a way to analyse the price of Bitcoin in a historical context. The Mayer Multiple is the multiple of the current price over the 200-days moving average.
"It does NOT tell whether to buy, sell or hold" but it gives you a pretty good idea of where we are at.
Basically
🔵Blue = Please buy🙏
🟢Light green = Looking for good entries 👀
🟢Green = Buy if you wish
🟡Yellow = This is starting to take off
🟠Orange = Looking for good exit 👀
🔴Red = You should get out of this
🔴Dark Red = You have balls, now please sell🙏

Bitcoin halving past datesThis indicator will help everyone to visualize the bitcoin halving effect on different assets

UT Bot AlertsUT Bot indicator was initially developer by @Yo_adriiiiaan
The idea of original code belongs @HPotter
These are v4 alerts for my previously published strategy:
Original script:

Profit HarbingerProfit Harbinger is privately owned paid indicator on trading view, It is what I consider to be the current precipices of my trading journey. After years of trading stocks and crypto working tirelessly to perfect my strategy it was only after really sitting down with my mentor and teacher that we developed the alpha version of this strategy. After working for what seemed like forever on the math, and code. I developed this indicator to work in my stead. This indicator is the development of the aforementioned strategy converted into a machine to take all the emotions out of trading the various trade-able assets.

Best Ichimoku ScreenerHello traders
Continuing deeper and stronger with the screeners' educational series one more time
I - Concept
This screener detects whether the price goes above, below or stays in between the Ichimoku cloud
II - How did I set the screener
The visual signals are as follow:
- square: Above or Below
Then the colors are:
- green when above the cloud
- red when below the cloud
- orange when in the cloud
Best regards,
Dave

[astropark] I love Fibonacci V1Dear Followers,
I Love Fibonacci is a tool designed to have a professional market momentum perspective to help you get rid of your emotions and trade more securely!
Don't let FOMO, fear and indecision take control of your trading actions!
Use it together with my 21 days EMA indicator
and EMA Ribbons
Here some examples on how to use them all together on EURUSD trading pair
and on BTCUSD trading pair
This is a free indicator, direct message me if you need further help.

BLX GravityWavesEstimates generational tops and bottoms for bitcoin. Only works correctly for the BLX ticker (BNC:BLX). Although it has worked extremely well until the point of publication, don't assume it will work in the future; do your own research! :)

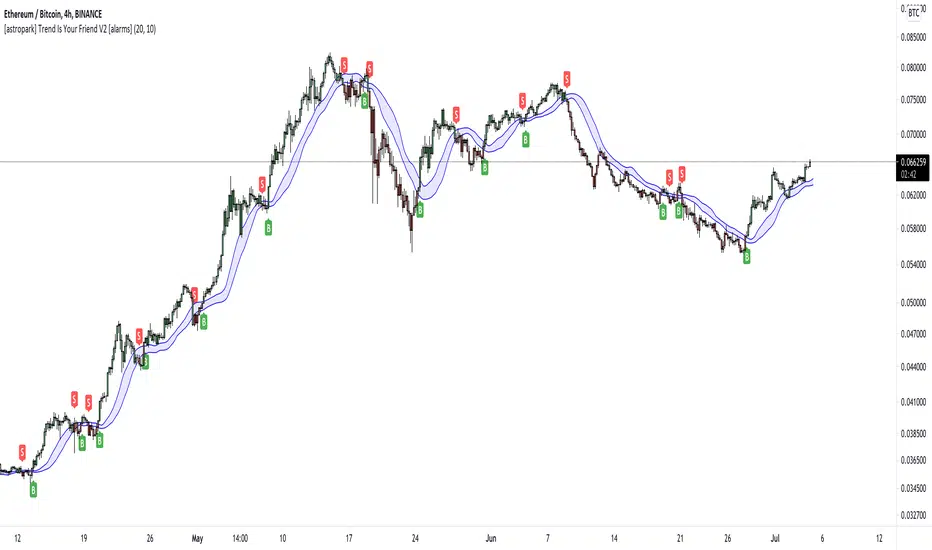
[astropark] Trend Is Your Friend V3 [alarms]Dear Followers,
today another awesome Swing and Scalping Trading Strategy indicator, runnable on a bot , which works great on High Timeframes (1D is suggested) but also on lower ones (just write me in order to help you find correct settings) and even better on 1m Renko chart!
If you are a scalper, you will love suggested entries for fast profit. You can run it on 1h timeframe (below is not suggested, there is "no-trend" below 1h!) if you are used to scalp trading and close each trade whenever you feel happy (a proper trailing stop strategy is suggested anyway).
This is not an evolution of "Trend Is Your Friend V1" or V2 , but a twin sister or the "Trend Is Your Friend V1" indicator you can see here below
and twin sister or the "Trend Is Your Friend V2" indicator you can see here below
This strategy differs for the engine used as basis, but has the same usage settings:
enable/disable signals on chart
enable/disable showing trend cloud
enable/disable bar coloring based on trend
enable/disable background coloring based on trend
edit trend period length (direct message me in order to help you fine best settings)
edit a smart variant option to enhance the trend cloud on your chart
enable/disable an option to smart enter trade
This strategy only trigger 1 buy or 1 sell. In order to get notified when a signal is triggered, you need to use the "alarms" version of this indicator.
Strategy results are calculated on the timeframe from December 2012 to now, so on 8 years, using 10000$ as initial capital and working at 1x leverage (so no leverage at all! If you like to use leverage, be sure to use a safe option, like 3x or 5x at most in order to have liquidation price very far).
This is not the "Holy Grail", so use a proper risk management strategy.
This script will let you set all notifications you may need in order to be alerted on each triggered signals.
The one for backtesting purpose can be found by searching for the astropark's "trend is your friend v3" and then choosing the indicator with "strategy" suffix in the name, or you can find here below
This is a premium indicator , so send me a private message in order to get access to this script.

LareauScript will trigger when RSI, Stoch and MA all line up. Day Chart or higher time frames
White Line when RSI and MA are lined up
Blue line when all three are lined up

[astropark] Trend Is Your Friend V2 [alarms]Dear Followers,
today another awesome Swing and Scalping Trading Strategy indicator, runnable on a bot , which works great on High Timeframes (1D is suggested) but also on lower ones (just write me in order to help you find correct settings) and even better on 1m Renko chart!
If you are a scalper, you will love suggested entries for fast profit. You can run it on 1h timeframe (below is not suggested, there is "no-trend" below 1h!) if you are used to scalp trading and close each trade whenever you feel happy (a proper trailing stop strategy is suggested anyway).
This is a twin sister or the "Trend Is Your Friend V1" indicator you can see here below
This strategy differs for the engine used as basis, but has the same usage settings:
enable/disable signals on chart
enable/disable showing trend cloud
enable/disable bar coloring based on trend
enable/disable background coloring based on trend
edit trend period length (you have to increase it if you go on lower timeframes or you go on FOREX/Stocks market, direct message me in order to help you fine best settings)
This strategy only trigger 1 buy or 1 sell. In order to get notified when a signal is triggered, you need to use the "alarms" version of this indicator.
Strategy results are calculated on the timeframe from January 2015 to now, so on 5 years, using 10000$ as initial capital and working at 1x leverage (so no leverage at all! If you like to use leverage, be sure to use a safe option, like 3x or 5x at most in order to have liquidation price very far).
This is not the "Holy Grail", so use a proper risk management strategy.
This script will let you set all notifications you may need in order to be alerted on each triggered signals.
The one for backtesting purpose can be found by searching for the astropark's "trend is your friend" and then choosing the indicator with "strategy" suffix in the name, or you can find here below
This is a premium indicator , so send me a private message in order to get access to this script.
[astropark] Trend Is Your Friend V1 [alarms]Dear Followers,
today another awesome Swing and Scalping Trading Strategy indicator, runnable on a bot , which works great on High Timeframes (1D is suggested) but also on lower ones (just write me in order to help you find correct settings) and even better on 1m Renko chart!
If you are a scalper, you will love suggested entries for fast profit. You can run it on 1h timeframe (below is not suggested, there is "no-trend" below 1h!) if you are used to scalp trading and close each trade whenever you feel happy (a proper trailing stop strategy is suggested anyway).
This strategy let's you edit following settings:
enable/disable signals on chart
enable/disable showing trend cloud
enable/disable bar coloring based on trend
enable/disable background coloring based on trend
enable a special option to enhance trend cloud on FOREX/Stocks charts (optional)
edit trend period length (you have to increase it if you go on lower timeframes, like 1h)
This strategy only trigger 1 buy or 1 sell. In order to get notified when a signal is triggered, you need to use the "alarms" version of this indicator.
Strategy results are calculated on the timeframe from August 2017 to now, so on almost 2 years and half, using 10000$ as initial capital and working at 1x leverage (so no leverage at all! If you like to use leverage, be sure to use a safe option, like 3x or 5x at most in order to have liquidation price very far).
This is not the "Holy Grail", so use a proper risk management strategy.
This script will let you set all notifications you may need in order to be alerted on each triggered signals.
The one for backtesting purpose can be found by searching for the astropark's "trend is your friend" and then choosing the indicator with "strategy" suffix in the name, or you can find here below
This is a premium indicator , so send me a private message in order to get access to this script.
